Figure 2. Graphic illustration of
simple and composite mapping of Tyrp1 expression in
whole eyes. A: A significant eQTL is present at the
location of Tyrp1 on Chr 4, making it a candidate
cis-eQTL. B: Composite interval mapping reveals a
suggestive eQTL on chromosome 9 at the location of Myo5a.
The blue traces in these interval maps indicate LRS scores
across the genome. Horizontal lines mark the transcript-specific
significant (LRS 17) and suggestive (LRS 11) thresholds based on
results of 1,000 permutations of original trait data.
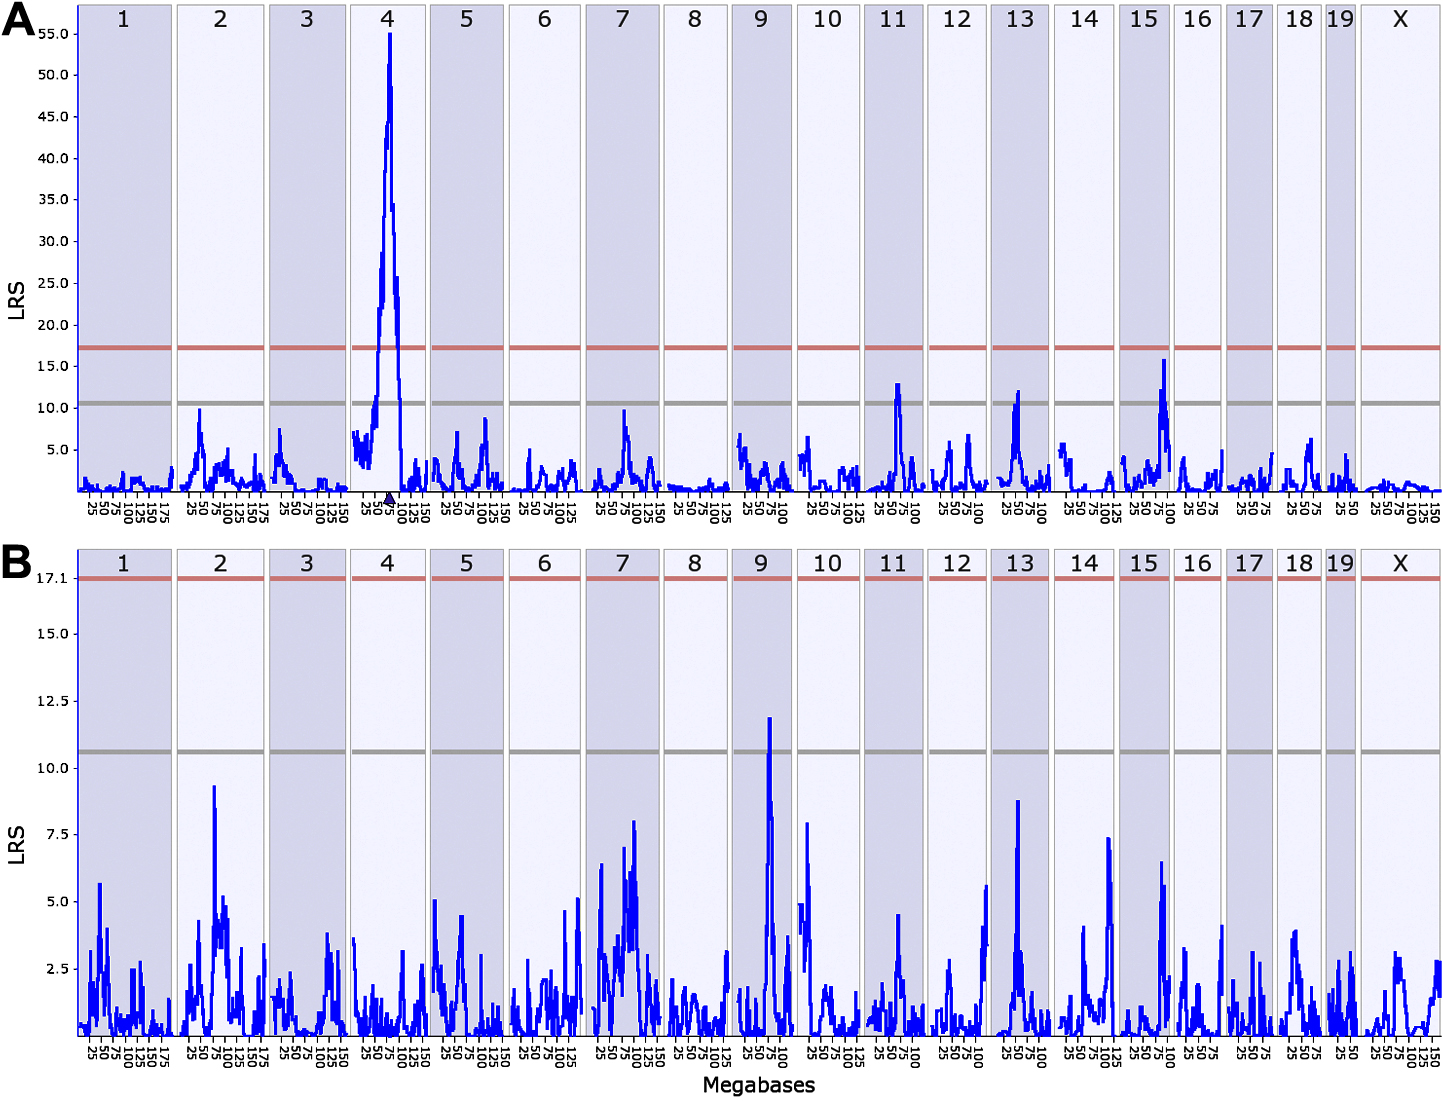
 Figure 2
of Lu, Mol Vis 2011; 17:2455-2468.
Figure 2
of Lu, Mol Vis 2011; 17:2455-2468.