Figure 5. Fluorescence spectra of WT αB-crystallin and its mutants following ANS binding. Spectra were recorded by excitation at 390
nm and emission from 400 to 600 nm using 0.2 mg/ml protein preparations mixed with 15 μl of 0.8 mM ANS (dissolved in methanol)
and incubated at 37 °C for 15 min. A: WT αB-crystallin and its deamidated and NH2-terminal domain deleted mutants. B: WT αB-crystallin and its deamidated and COOH-terminal extension deleted mutants. The dotted lines indicated the wavelength
of maximum peak fluorescence (λmax) observed in WT αB-crystallin, used to determine whether a blue or a red shift in wavelength occurred.
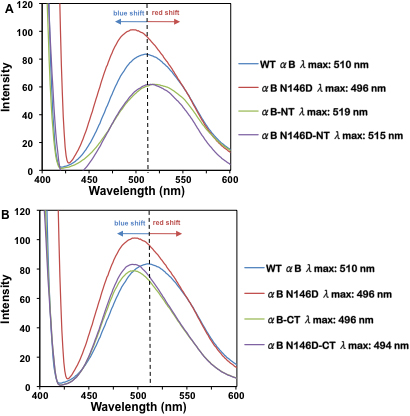
 Figure 5 of
Asomugha, Mol Vis 2011; 17:2407-2420.
Figure 5 of
Asomugha, Mol Vis 2011; 17:2407-2420.