Figure 4. Intrinsic Trp and total fluorescence spectra of WT αB-crystallin and its mutant proteins. A: Total fluorescence spectra (Ex 290 nm, Em 300–400 nm) were recorded for the NH2-terminal domain deleted mutants because Trp residues 9 and 60 were deleted along with the deletion of this domain. B: Intrinsic Trp fluorescence spectra (Ex 295 nm, Em 300–400 nm) were recorded for mutants containing the NH2-terminal domain. The dotted lines indicate the wavelength of maximum peak fluorescence (λmax) observed in WT αB-crystallin, used to determine whether a blue or red shift in wavelength occurred.
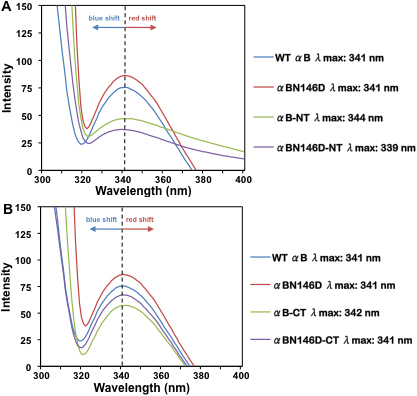
 Figure 4 of
Asomugha, Mol Vis 2011; 17:2407-2420.
Figure 4 of
Asomugha, Mol Vis 2011; 17:2407-2420.