Figure 3. Effect of long-term desiccation on the expression of cytokines in CEPI cells. A: Photograph of RT–PCR results of IL-6 and IL-8 expression. B: Expression of IL-6 and IL-8 detected by real-time RT–PCR. The horizontal axis shows the length of time of desiccation, and the vertical axis shows the
expression ratio of cytokines. The expression level at 0 h was defined as 1. Results are expressed as the mean±SD (n=6). Dunnett’s
test was used to determine the significance of differences. The asterisk indicates a significant difference from the result
at 0 min, p<0.05.
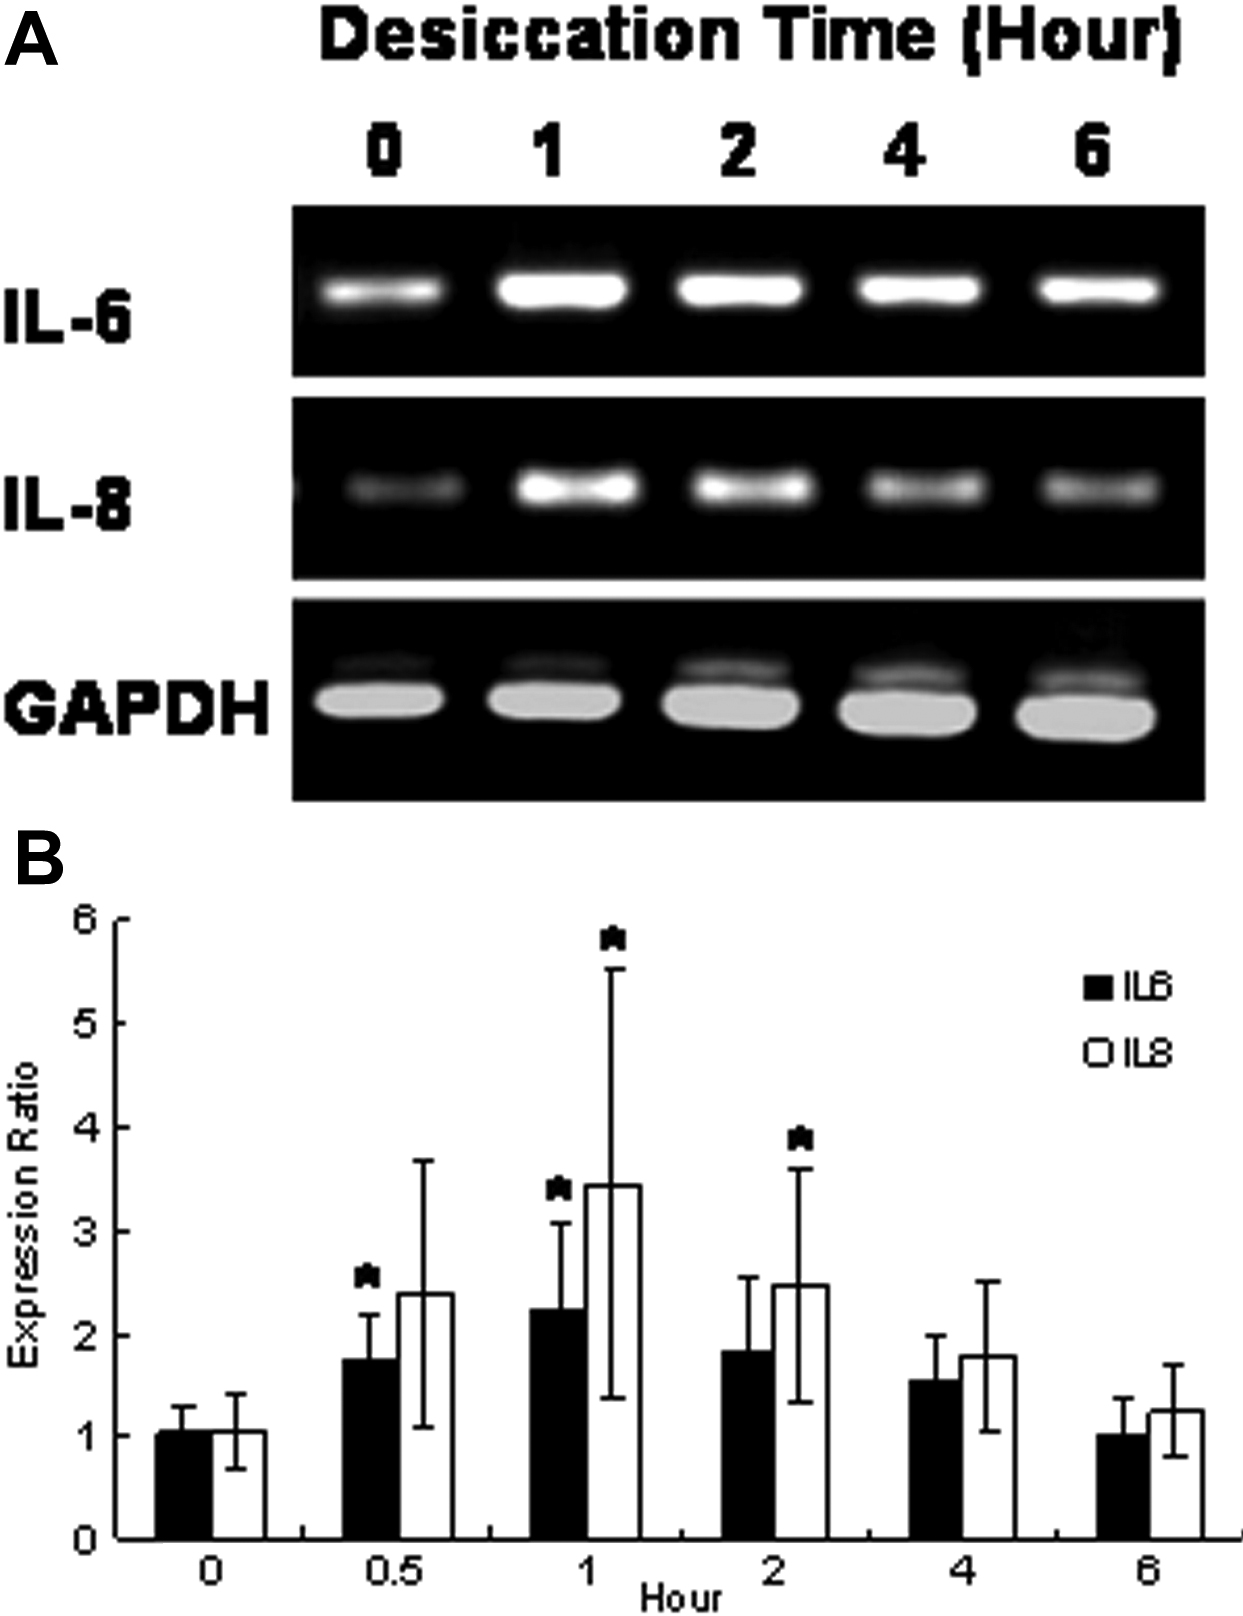
 Figure 3 of
Higuchi, Mol Vis 2011; 17:2400-2406.
Figure 3 of
Higuchi, Mol Vis 2011; 17:2400-2406.