Figure 2. Effect of long-term
desiccation on CEPI cells. CEPI cells were subjected to
desiccation for up to 8 h. The horizontal axis shows the length
of time that the cells were subjected to desiccation. A:
Cellular viability of CEPI cells. B-D:
Concentrations of IL-6 (B), IL-8 (C), or TNF-α (D)
in the medium secreted from CEPI cells. Results are expressed as
the mean±SD (n=6). Dunnett’s test was used to determine the
significance of differences. The asterisk indicates a
significant difference from the result at 0 min, p<0.05.
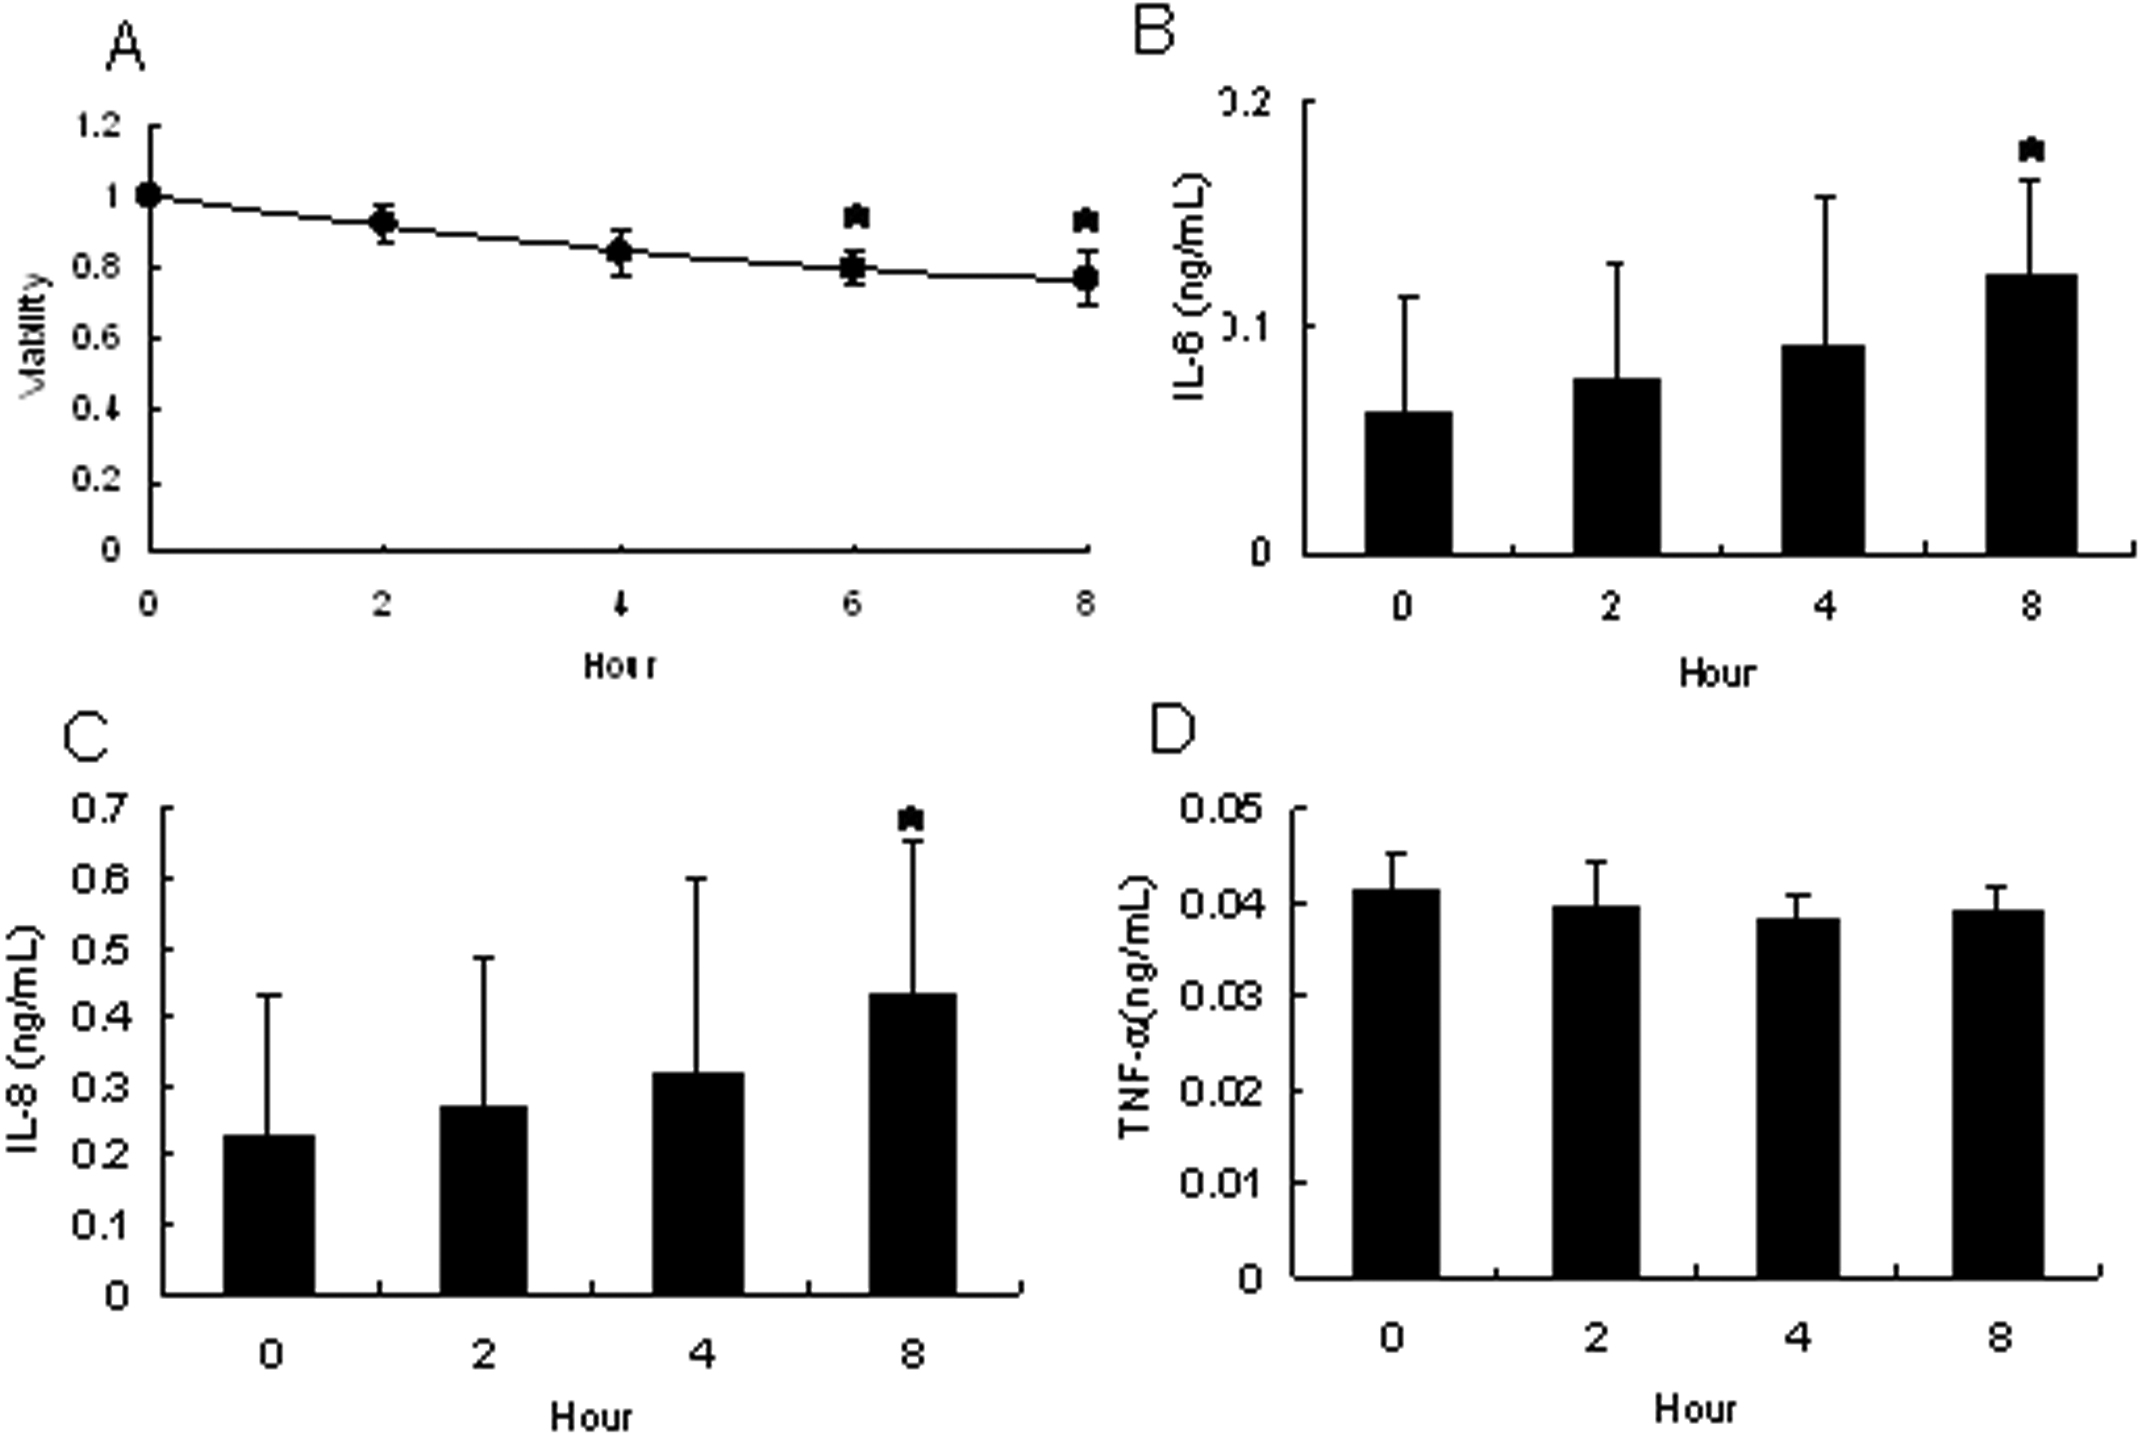
 Figure 2
of Higuchi, Mol Vis 2011; 17:2400-2406.
Figure 2
of Higuchi, Mol Vis 2011; 17:2400-2406.