Figure 2. Hierarchical clustering of all 1,386 differentially expressed probes in either the S- or the CB-corneal neovascularization
model. The color bar located in upper left corner stands for the folds of probe changes (in log2 value), while the gray color in the heat maps indicates that the value was absent in a specified microarray. S, suture; CB,
chemical burn.
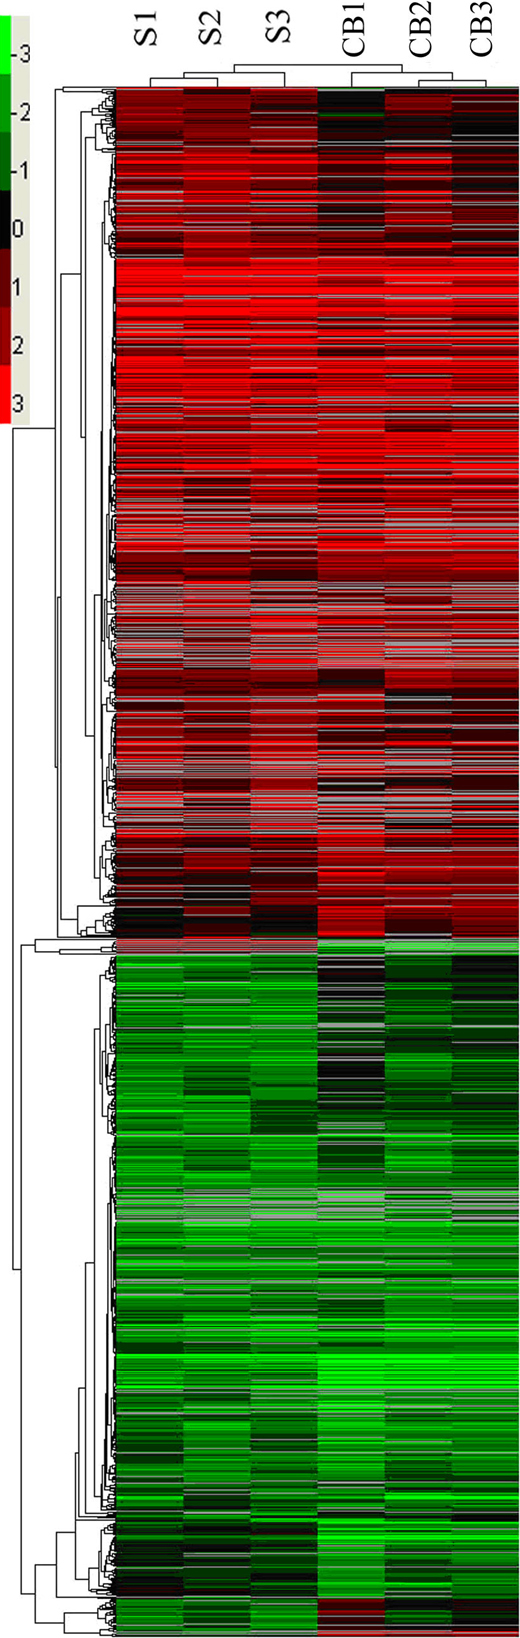
 Figure 2 of
Jia, Mol Vis 2011; 17:2386-2399.
Figure 2 of
Jia, Mol Vis 2011; 17:2386-2399.