Figure 4. Structure homology modeling and comparison of mutant protein and native human CX26 (2zw3F). A: Native human cx26, B: Mutant protein CX50. Red, yellow and blue indicate α-helix, β-sheet and β-turn, respectively, white indicates other residues.
D and N represent Asp47 and Asn47, respectively.
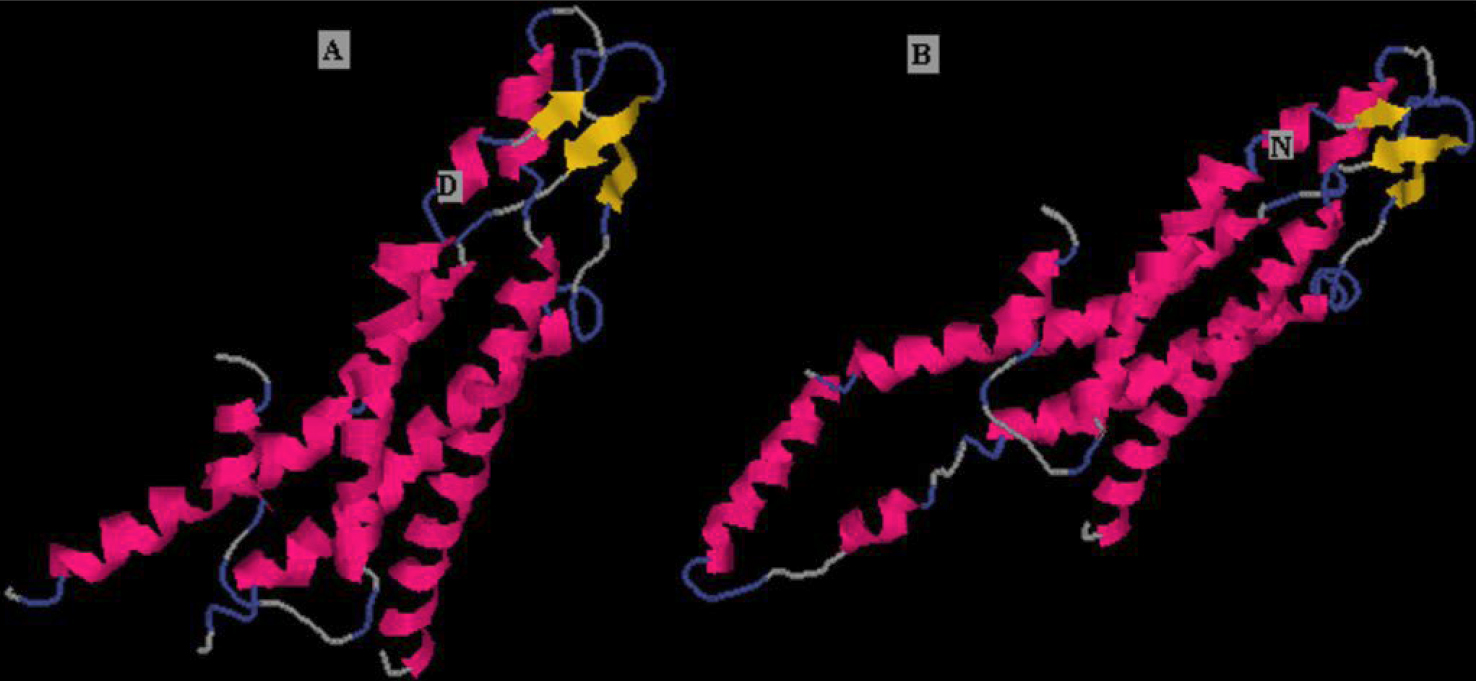
 Figure 4 of
Wang, Mol Vis 2011; 17:2380-2385.
Figure 4 of
Wang, Mol Vis 2011; 17:2380-2385.