Figure 9. Immunofluorescence of β3. Control: β3-IR (green) was present in every acinar cell as numerous punctate staining within the
cytoplasm (arrowheads) in a diffuse pattern. However, minimal β3-IR was detected in the duct cells (arrows). IAD: the distribution
pattern of β3-IR from rabbits with IAD was similar to that of control rabbits, i.e., numerous punctate β3-IR was detected
in the cytoplasm of every acinar cell (arrowheads), while minimal β3-IR was present in the duct cells (arrows). Red: F-actin
that has been stained with rhodamine. Scale bar=50 μm.
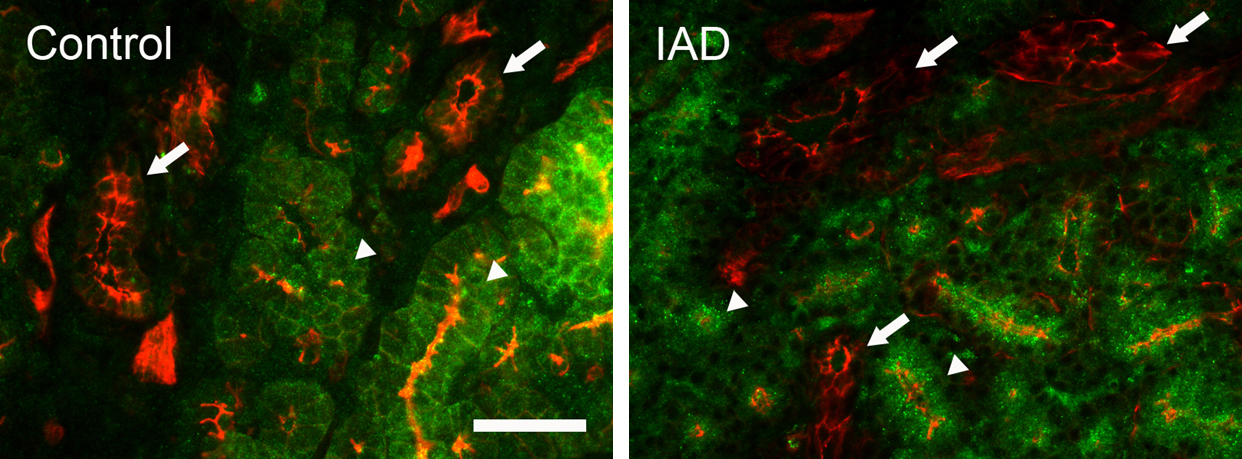
 Figure 9 of
Ding, Mol Vis 2011; 17:2368-2379.
Figure 9 of
Ding, Mol Vis 2011; 17:2368-2379.