Figure 8. Immunofluorescence of β2. Control: β2-IR (green) was present in all acinar cells as numerous punctate staining that aggregate
toward the apical cytoplasm (arrowheads), while its intensity was much higher in ducts (arrow). IAD: the distribution pattern
of β2-IR was similar in LG from rabbits with IAD with those in control rabbits, i.e., numerous punctate β2-IR was detected
in the cytoplasm of every acinar cell (arrowheads), while β2-IR was much stronger in ducts (arrows). Red: F-actin that has
been stained with rhodamine-conjugated phalloidin. Scale bar=100 μm.
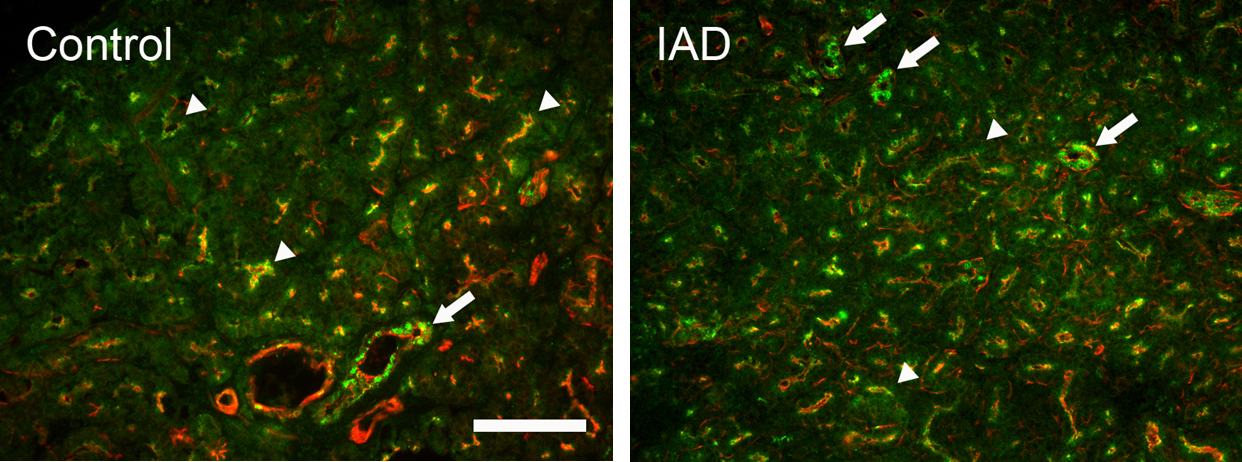
 Figure 8 of
Ding, Mol Vis 2011; 17:2368-2379.
Figure 8 of
Ding, Mol Vis 2011; 17:2368-2379.