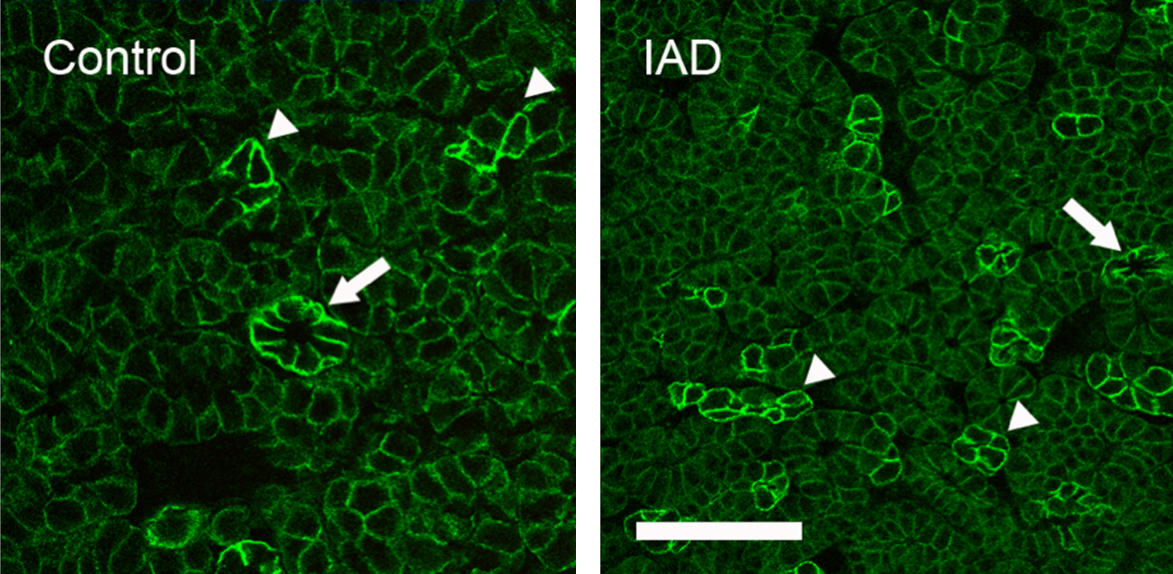
Figure 7. Immunofluorescence of β1.
Control: Like α1, β1-IR was also only present in the basolateral
membranes of all acinar and ductal cells, and numerous punctate
staining within the cytoplasm. However, levels of β1-IR differed
in a “mosaic” pattern, higher in some acinar cells and/or acini
(arrowheads) than others. β1-IR in ductal cells was uniformly
higher (arrow). These data were similar to our previous report [
13].
IAD: like in control animals, β1-IR was also present in all
acinar cells and demonstrated a similar “mosaic” pattern
(arrowheads). Ducts also showed a much higher β1-IR (arrow). No
significant difference of β1-IR was observed between control and
IAD animals. Scale bar=50 μm.
 Figure 7
of Ding, Mol Vis 2011; 17:2368-2379.
Figure 7
of Ding, Mol Vis 2011; 17:2368-2379.