Figure 6. Immunofluorescence of α2. Control: Minimal α2-IR was detected in acinar cells (arrows), while strong α2-IR was observed in
ductal cells as clustered punctate staining (arrowheads). IAD: The distribution of α2-IR in LG from rabbits with IAD was very
similar to that of control animals, i.e., α2-IR was mostly found in ductal cells as clusters of punctate staining. Red: F-actin
that has been stained with rhodamine-conjugated phalloidin. Scale bar=50 μm.
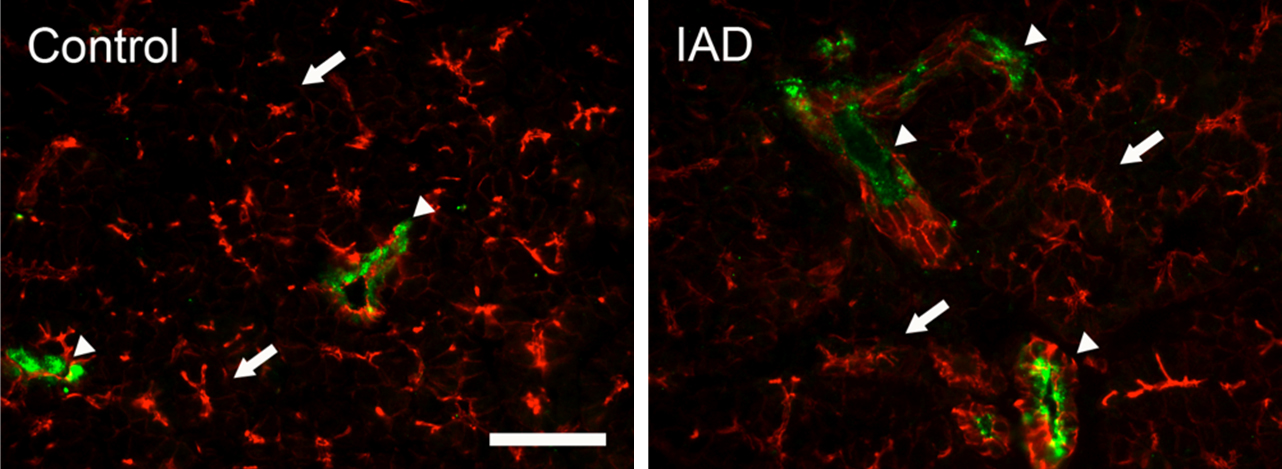
 Figure 6 of
Ding, Mol Vis 2011; 17:2368-2379.
Figure 6 of
Ding, Mol Vis 2011; 17:2368-2379.