Figure 5. Immunofluorescence of α1. Control: α1-IR (green) was present in every acinar cell, most prominently in the basolateral membranes,
but not on the apical membranes. The α1-IR was much stronger in some acini/acinar cells (arrowheads), while much weaker in
other acini/acinar cells (arrows), giving the gland a “mosaic” pattern. Ducts (D) were all stained as strongly as those acinar
cells showing intense α1-IR. IAD: the distribution pattern of α1-IR was similar to those in control rabbits, and no significant
difference was detected. Scale bar=100 μm.
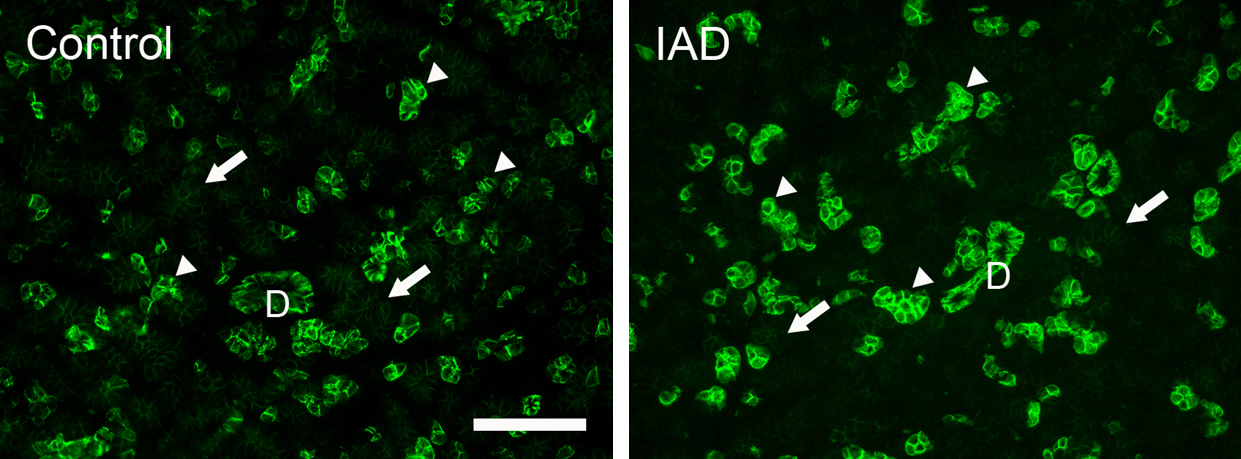
 Figure 5 of
Ding, Mol Vis 2011; 17:2368-2379.
Figure 5 of
Ding, Mol Vis 2011; 17:2368-2379.