Figure 5. Chaperone activity comparison of WT αA and αB and their individual domain constructs. The chaperone activity, calculated as
% protection, was assayed by measuring DTT-induced insulin (100 μg) aggregation in the presence of chaperone/insulin ration
(1:1) at 25 °C. Error bars=Percent Error (+/− 1%).
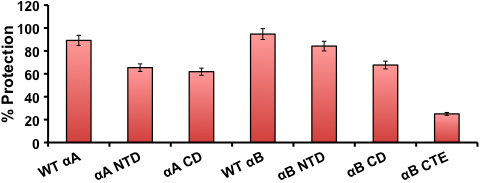
 Figure 5 of
Asomugha, Mol Vis 2011; 17:2356-2367.
Figure 5 of
Asomugha, Mol Vis 2011; 17:2356-2367.