Figure 3. Far-UV CD spectra of WT αA, WT αB and their individual domain constructs. Spectra were recorded using protein preparations
of 0.2 mg/ml, dissolved in 50 mM sodium phosphate buffer (pH 7.8), and a cell path length of 0.5 mm. The reported spectra
are the average of 5 scans, corrected for the buffer blank, and smoothed. A: WT αA, NH2-terminal domain, and core domain constructs. B: WT αB, NH2-terminal domain, core domain, and COOH-terminal extension constructs.
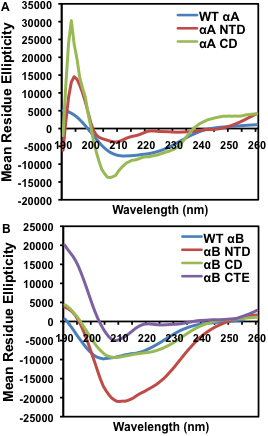
 Figure 3 of
Asomugha, Mol Vis 2011; 17:2356-2367.
Figure 3 of
Asomugha, Mol Vis 2011; 17:2356-2367.