Figure 5. Using the selected concentration of EGF to further test the inhibitory effect of EGFR siRNA on cells. MTT and growth curve array were applied. Compared to the control group, it can be seen that the EGFR siRNA group was almost unchanged when co-supplied with EGF. p<0.05.
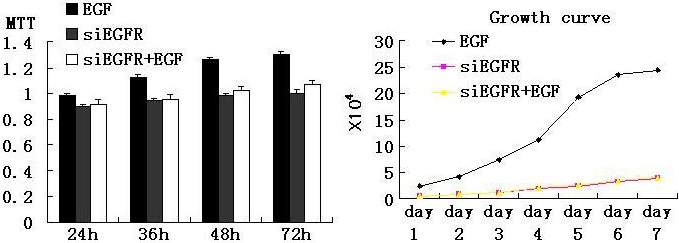
 Figure 5 of
Huang, Mol Vis 2011; 17:2349-2355.
Figure 5 of
Huang, Mol Vis 2011; 17:2349-2355.