Figure 5 of
Jauhonen, Mol Vis 2011; 17:2311-2317.
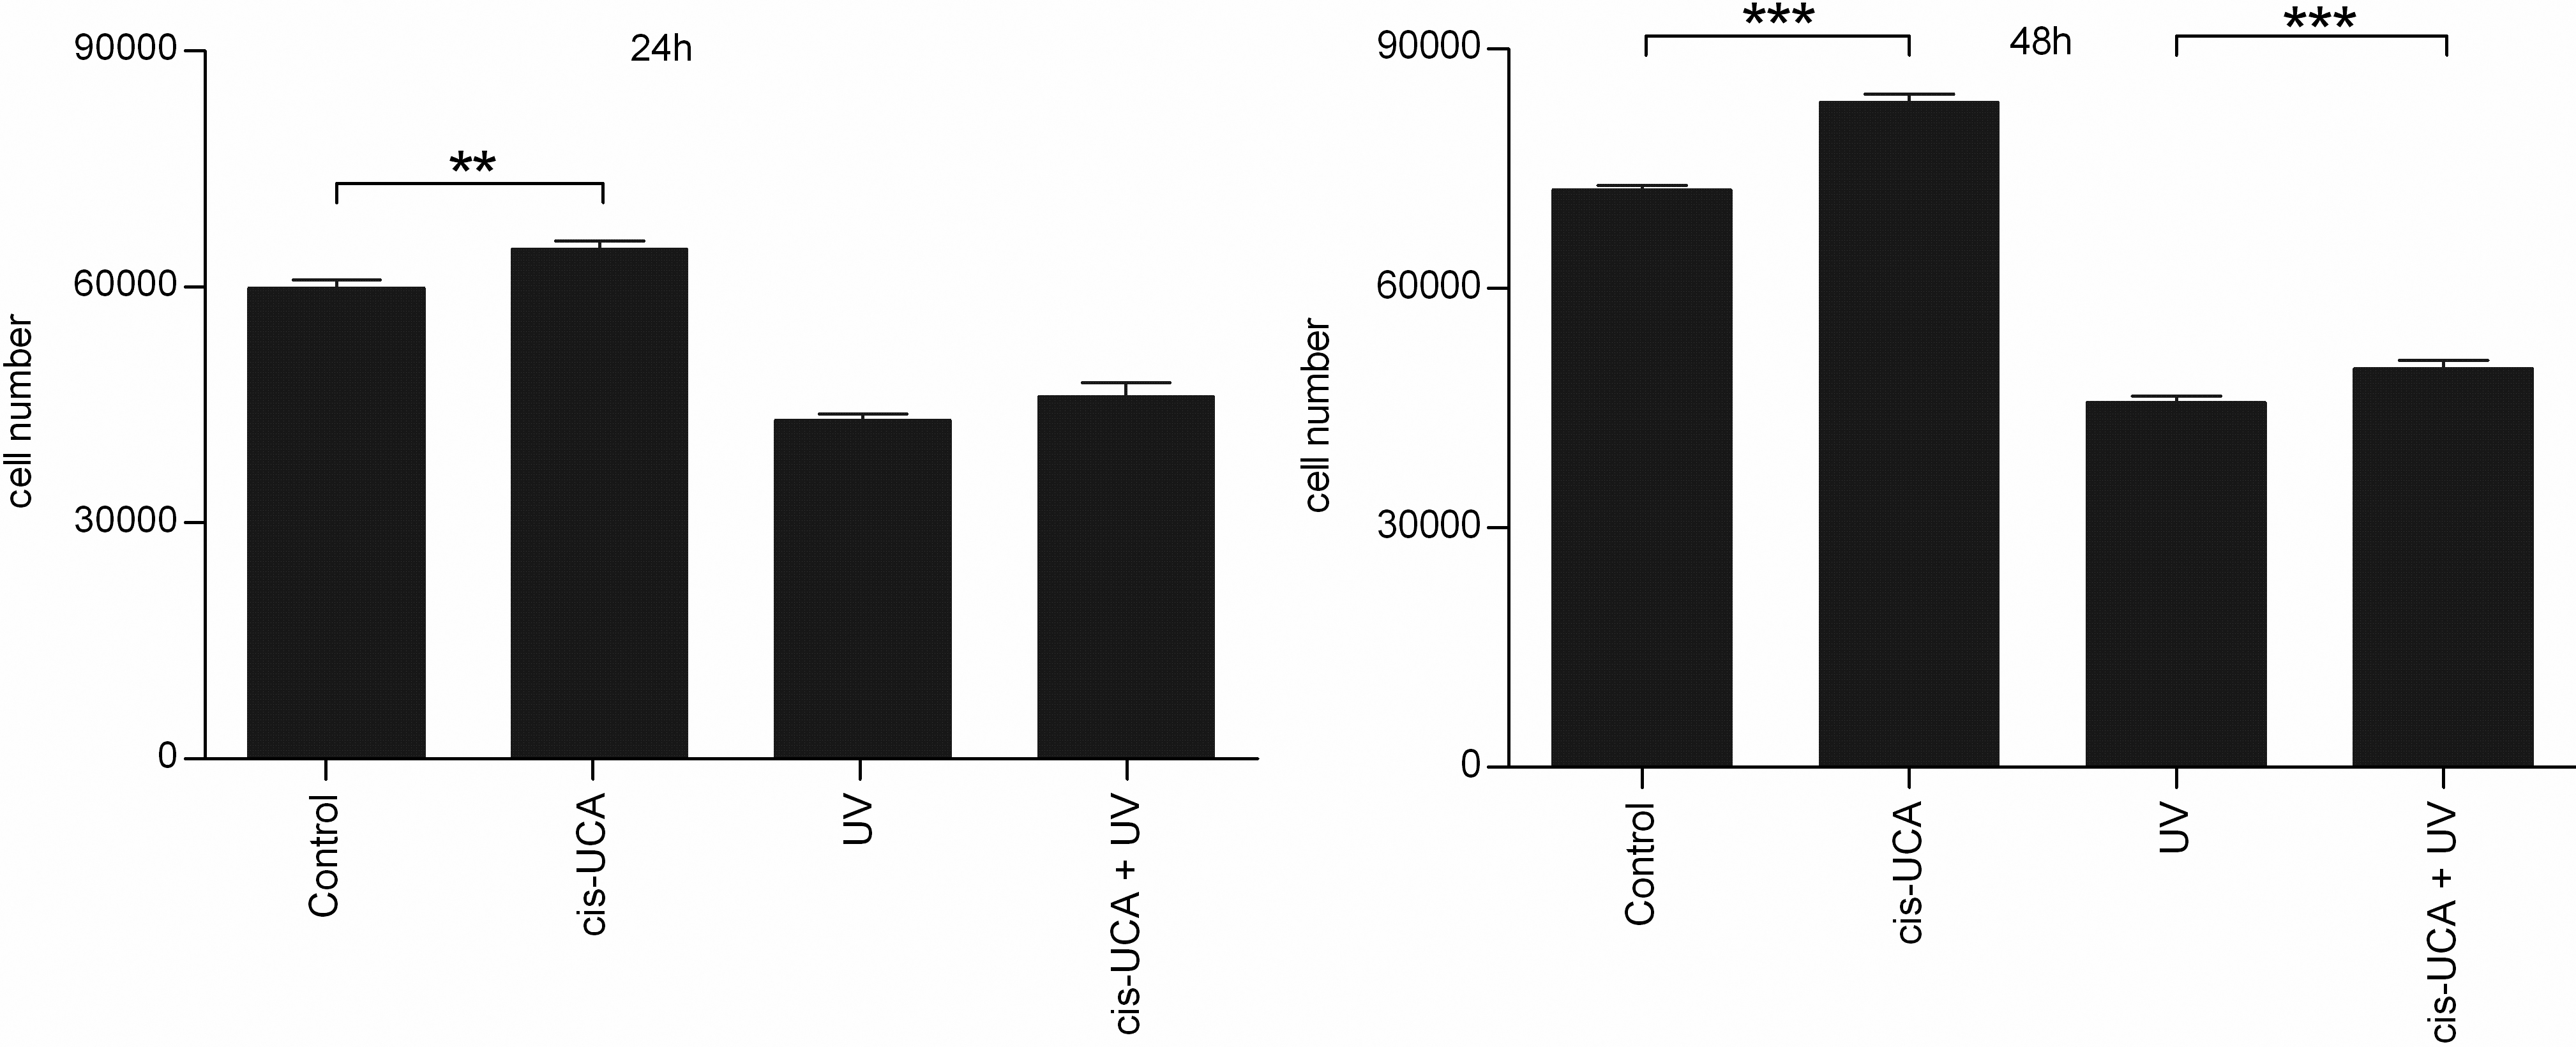
Figure 5.
Proliferation of HCE-2 cells. Results are presented as mean cell numbers ±SEM cis-UCA concentration was 100 µg/ml. Eight parallel samples were measured in all groups. **p<0.01; ***p<0.001 (Mann–Whitney).
 Figure 5
of Jauhonen, Mol Vis 2011; 17:2311-2317.
Figure 5
of Jauhonen, Mol Vis 2011; 17:2311-2317.