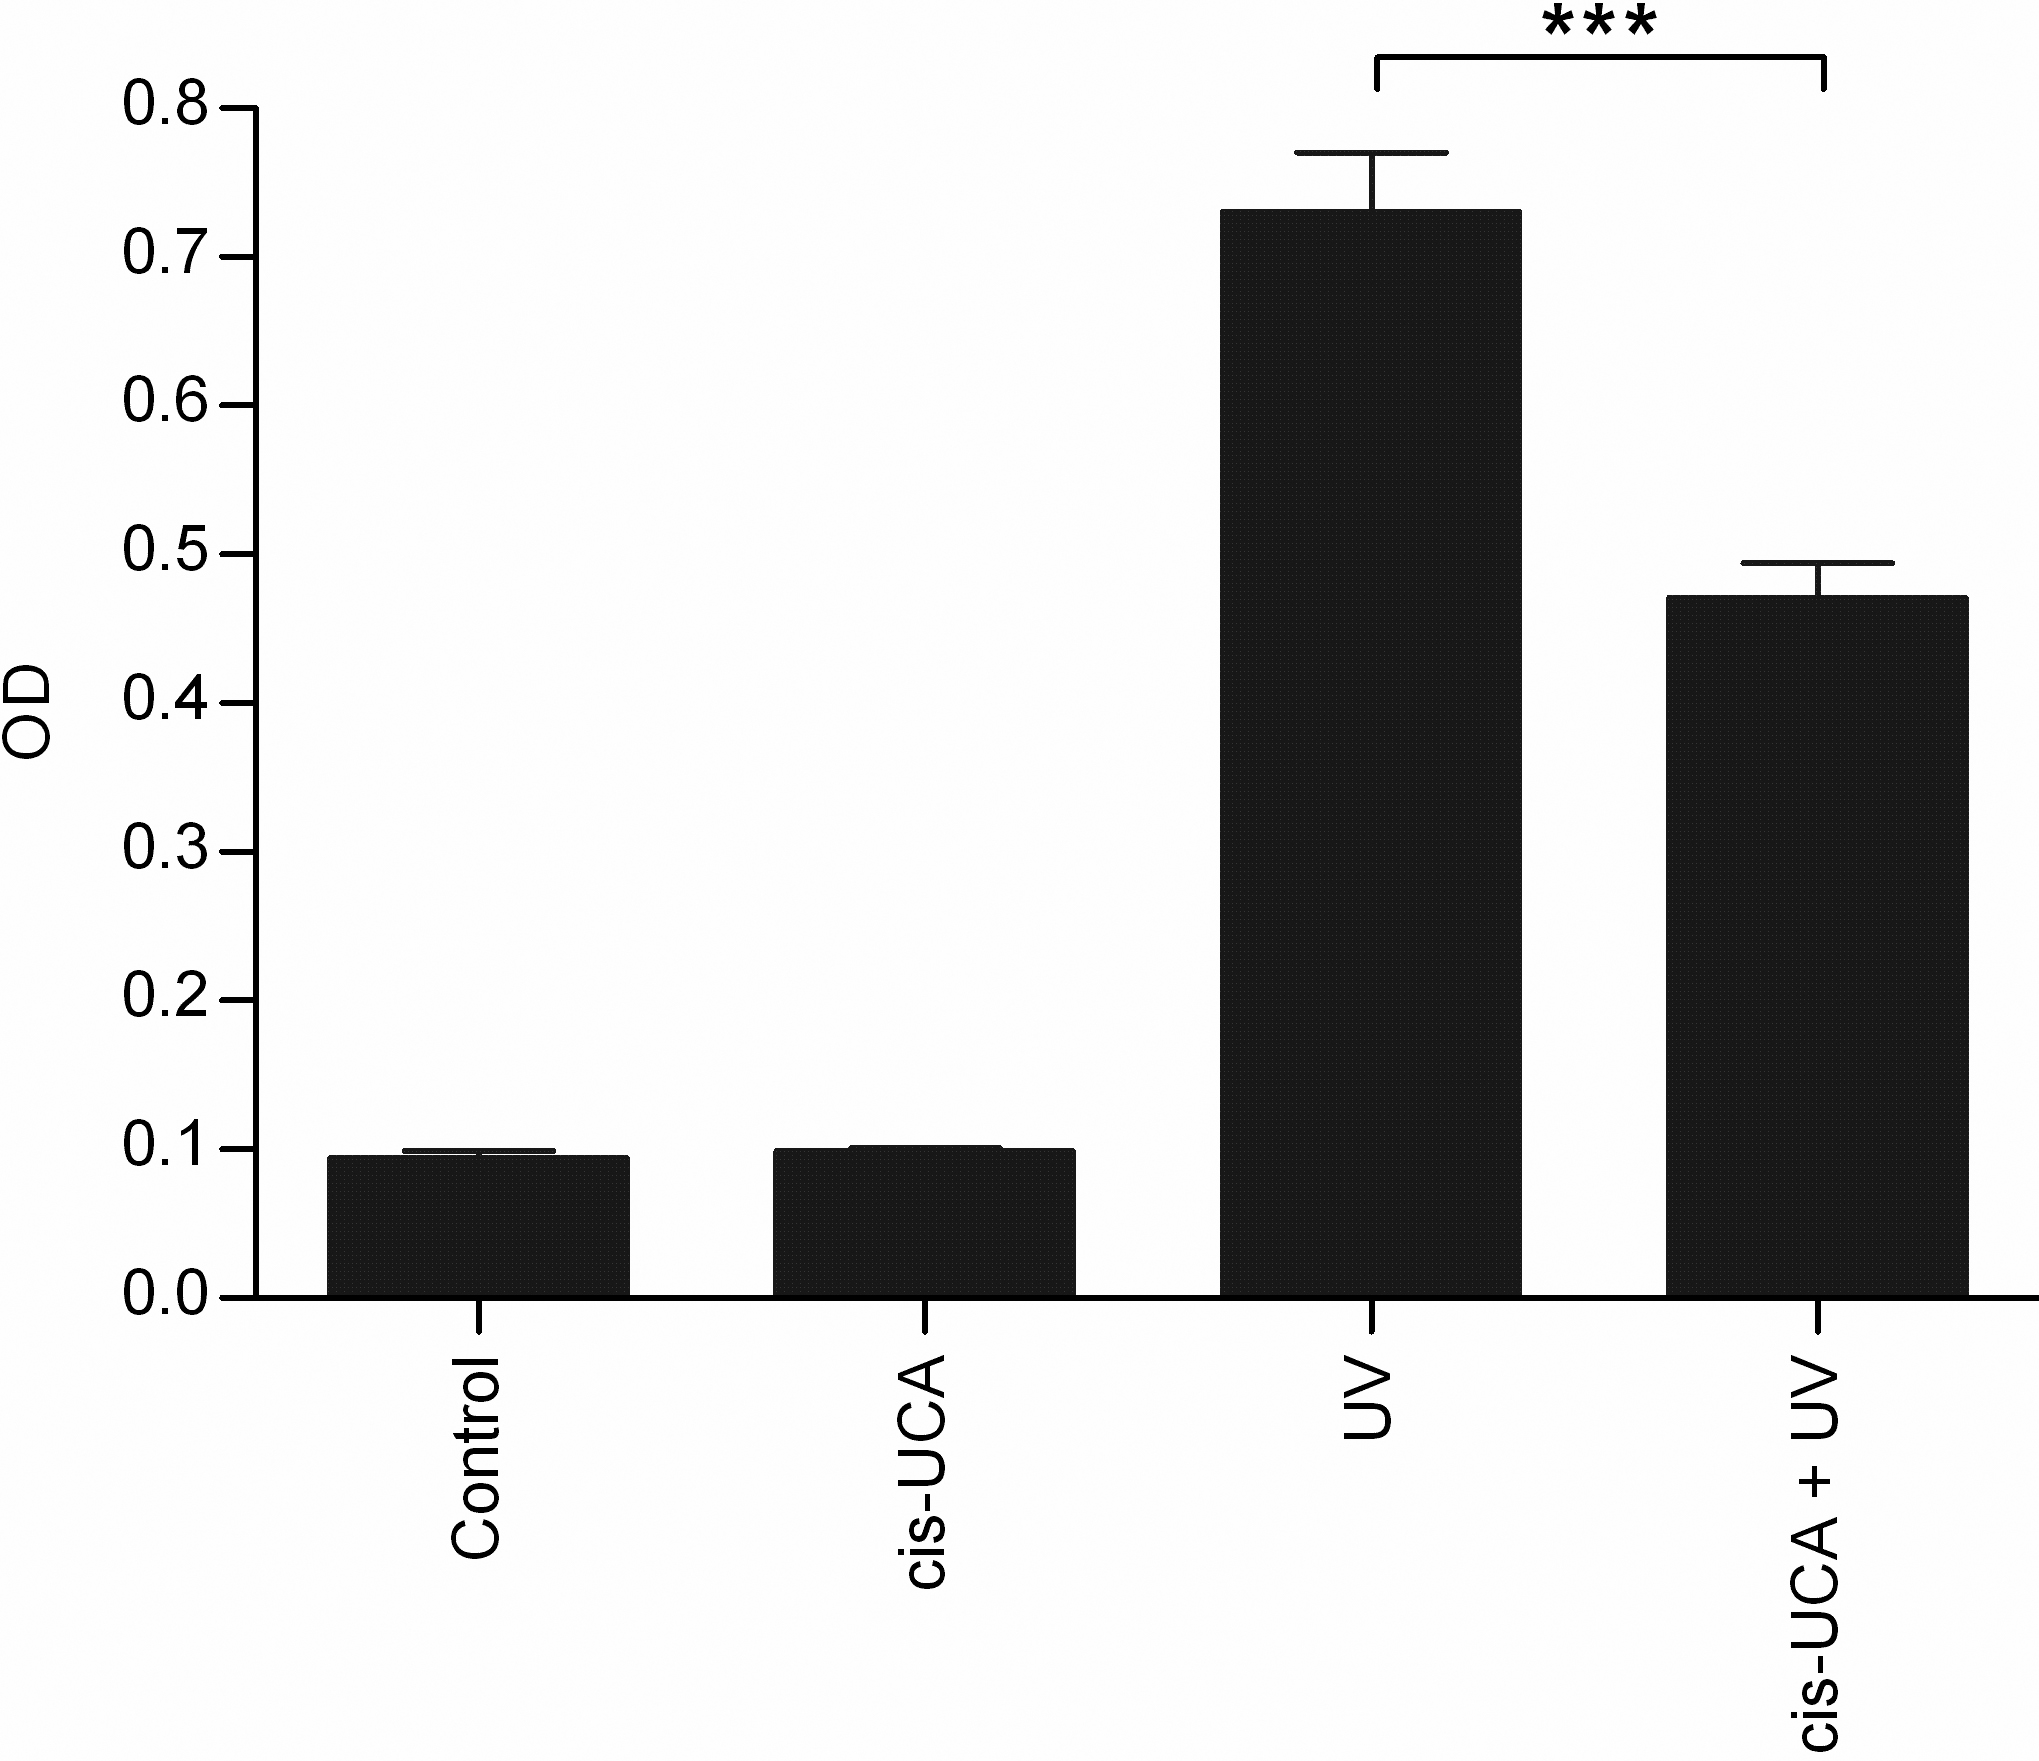
Figure 3. Phosphorylation of c-Jun
(Ser63) 6 h after stimulation. Results are presented as mean
optical density (OD) ±SEM cis-UCA concentration was 100 µg/ml.
Seven parallel samples were measured in control and cis-UCA, and
nine parallel samples in UV and cis-UCA + UV treatments.
***p<0.001 (Mann–Whitney).

 Figure 3
of Jauhonen, Mol Vis 2011; 17:2311-2317.
  Figure 3
of Jauhonen, Mol Vis 2011; 17:2311-2317.