Figure 2 of
Awadalla, Mol Vis 2011; 17:2248-2254.
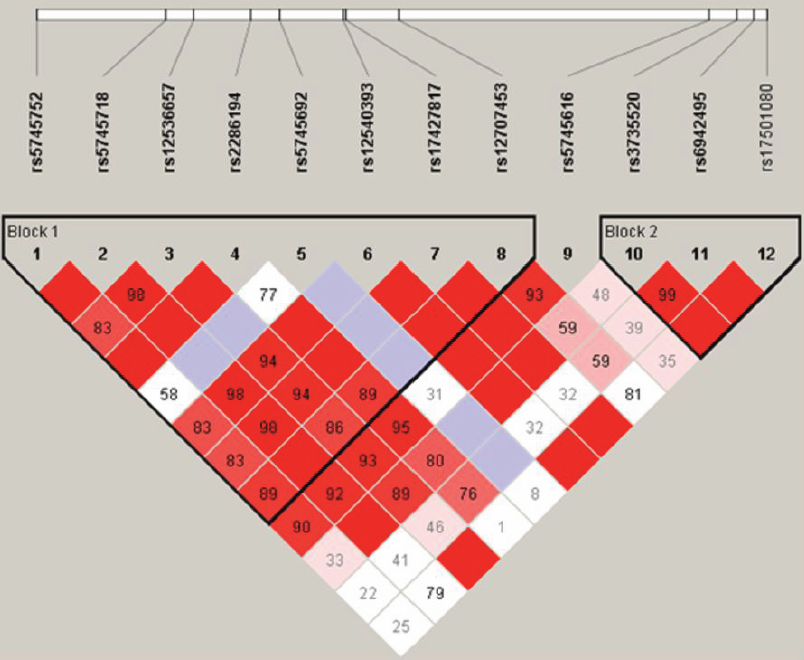
Figure 2.
Linkage disequilibrium plot generated in Haploview shows the haplotype block structure using the solid spine definition. 100*׀D’׀ values are given. An empty cell indicated D’=1. The darker the red shading, the larger the ׀D’׀.
 Figure 2 of
Awadalla, Mol Vis 2011; 17:2248-2254.
Figure 2 of
Awadalla, Mol Vis 2011; 17:2248-2254.