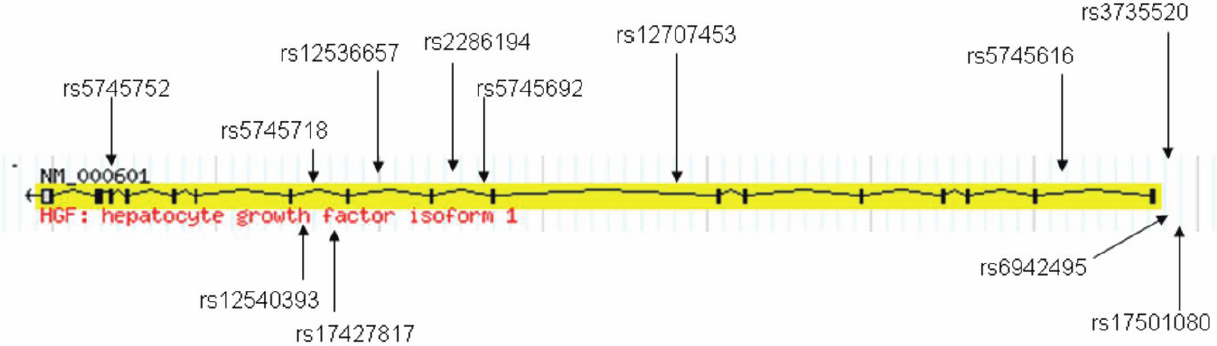
Figure 1. HGF gene idiogram depicting the location of all tagging SNPs, with the previously published hyperopia SNPs (above the line).
Exons are indicated by gray or solid boxes and joined by introns indicated by lines. Figure adapted from the
HapMap website.
 Figure 1 of
Awadalla, Mol Vis 2011; 17:2248-2254.
Figure 1 of
Awadalla, Mol Vis 2011; 17:2248-2254.