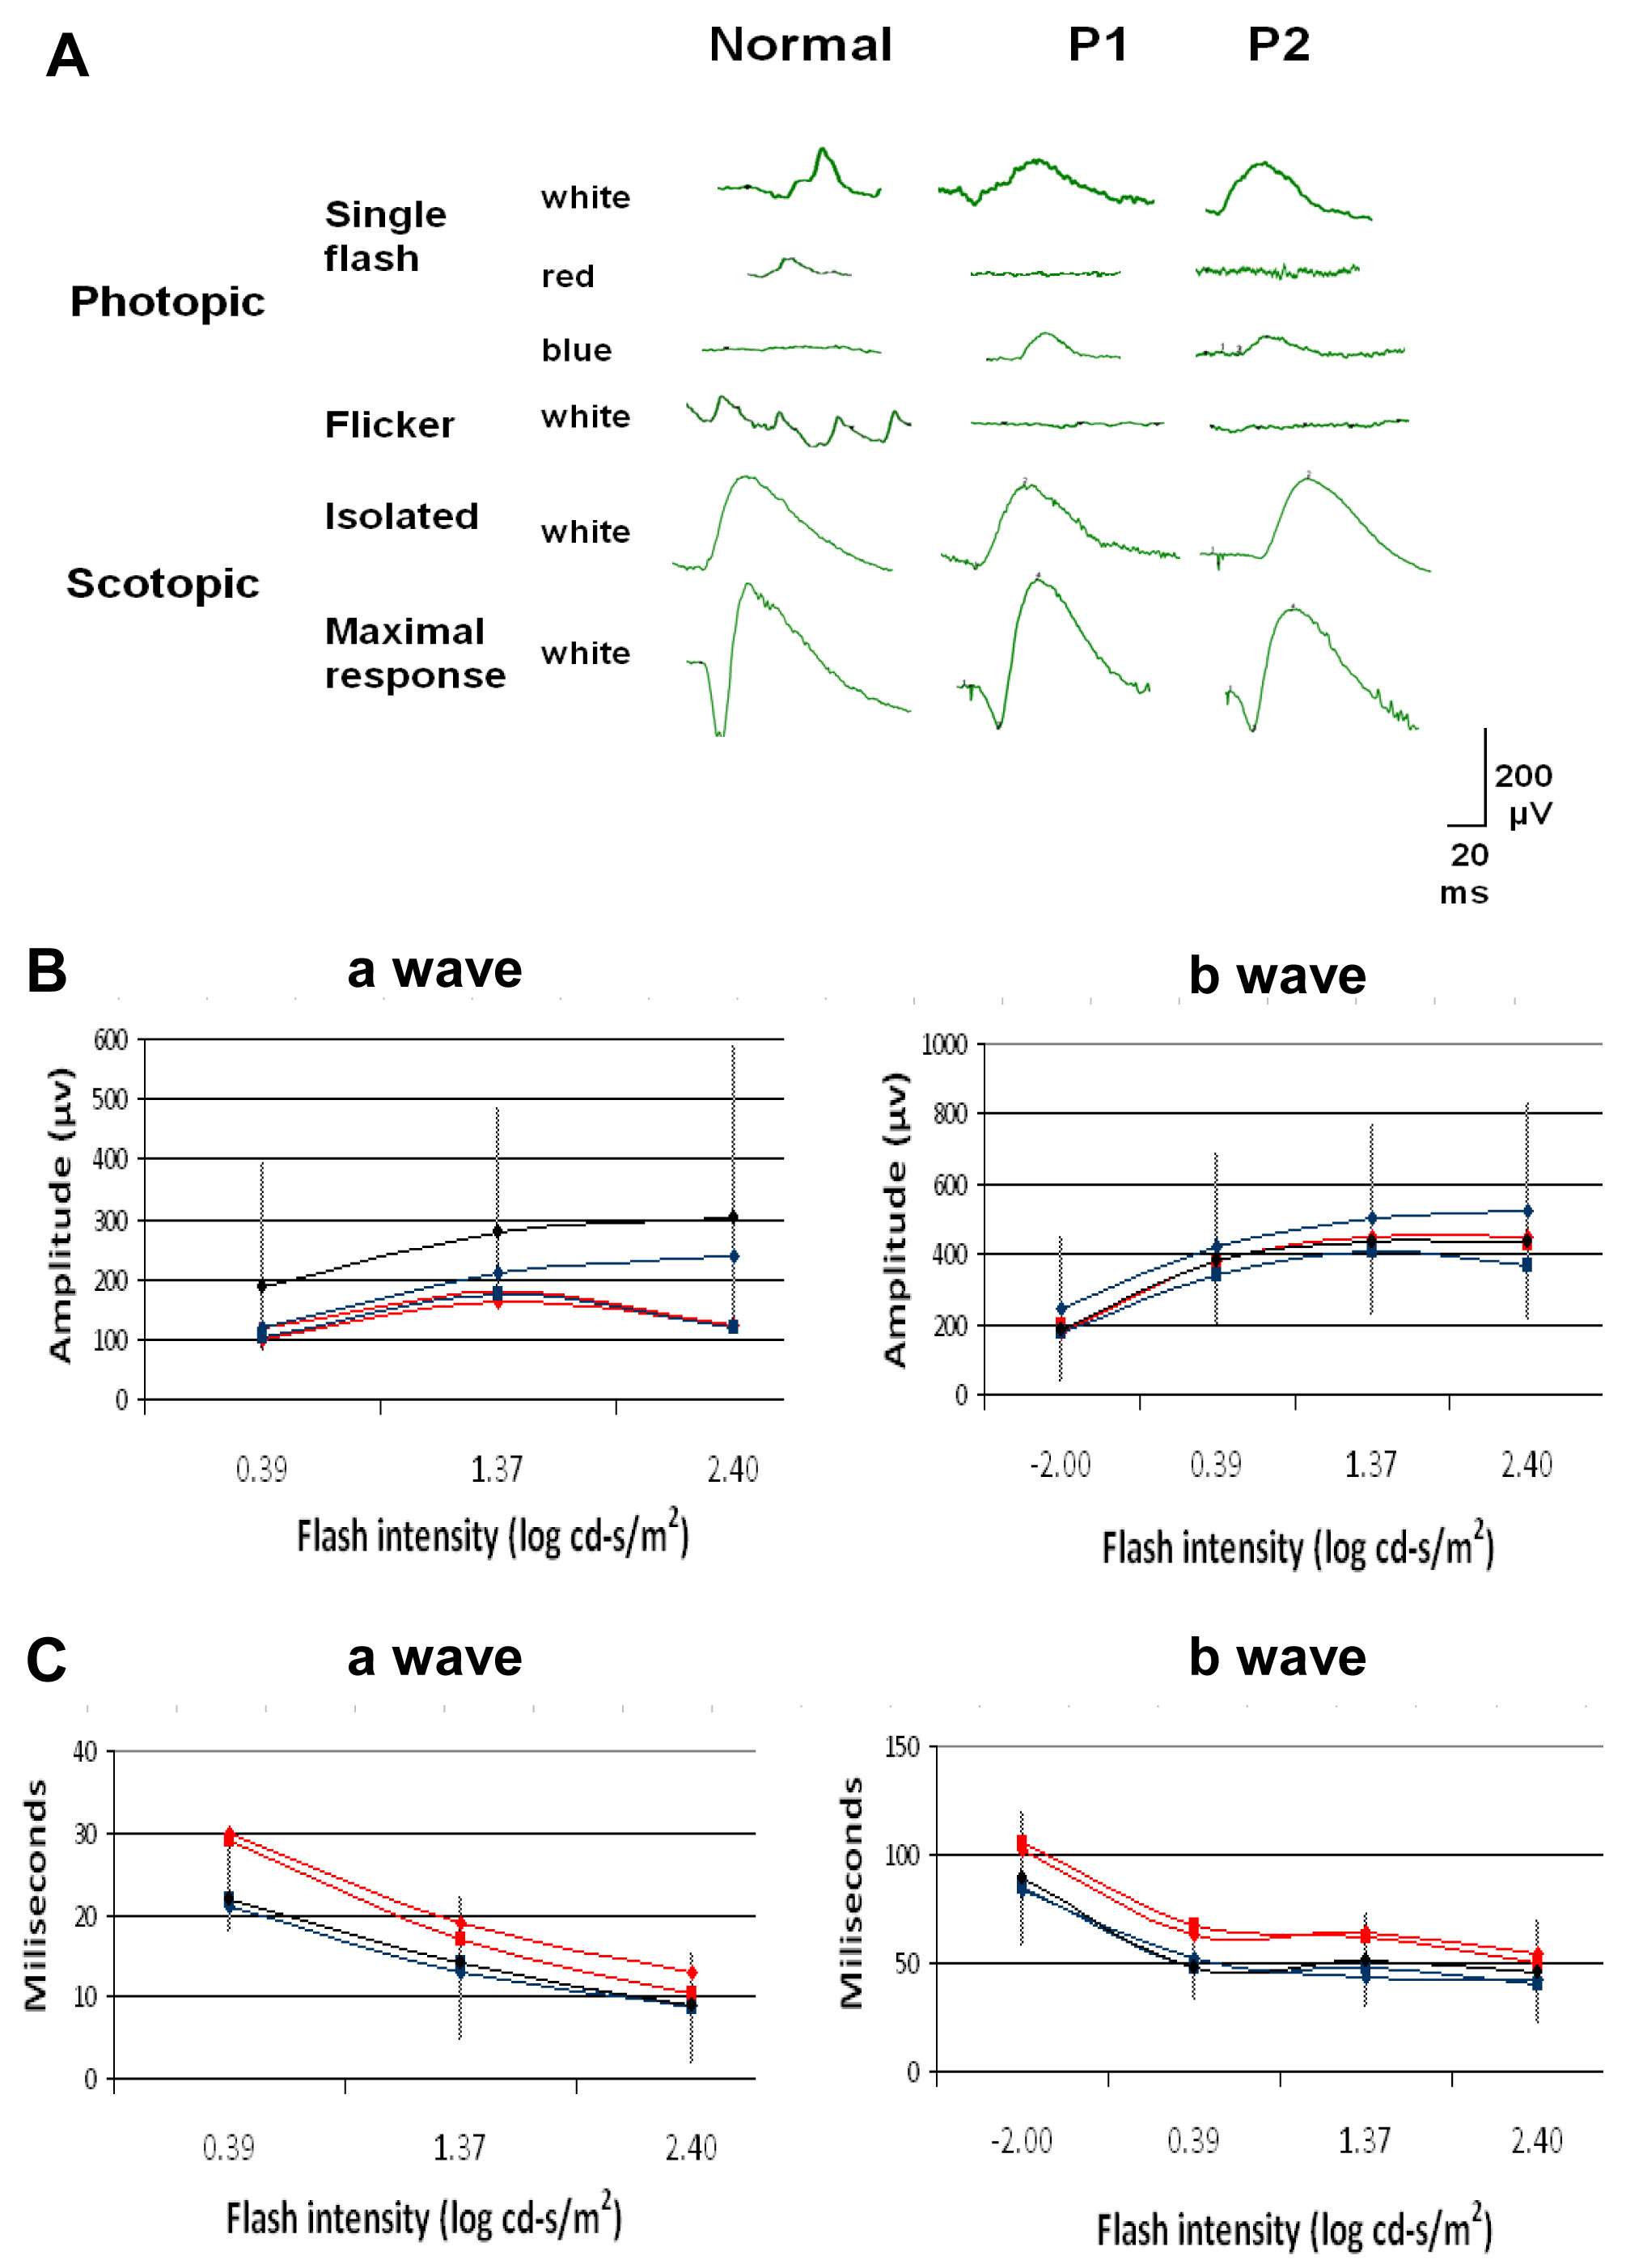
Figure 2. Electroretinograms from
patient 1 (P1) and patient 2 (P2) compared to a normal subject.
A: Photopic responses. No responses to red stimuli can be
detected, whereas white stimuli show responses that are mostly
within normal limits. Amplitudes of the response to blue stimuli
are markedly higher than in normal subjects. Photopic 30-Hz
flicker ERG responses are absent. Isolated rod b-wave amplitudes
and maximal responses are generally within the normal limits
(see
B).
B: Plots of scotopic response
intensities from both patients. ERG intensities are shown as
logarithmic values of stimulus intensity. P1 and P2 are
represented in red and blue lines, respectively (one line for
each eye). Black and Vertical lines represent the normal average
and range from 100 normal eyes, respectively. As this parameter
does not follow a normal (Gaussian) distribution but is skewed [
15,
16], to obtain
the normal range the values were first converted to their log
10
values, which normalizes the distribution. Mean values±2.5
standard deviations (SD) were then calculated and the values
were converted back to their antilog values. The a-wave
amplitudes (left) are generally within the lower normal limit
(except for P1 at the lowest ERG intensity, where it is lower
than normal). The b-wave amplitudes (right) are within normal
limits at all light intensities tested.
C: Latency plots
of the scotopic responses from both patients. For normal values,
the normal range was calculated as the mean±2.5 SD. The a-wave
latencies (left) are within normal limits (except for P1 at the
lowest ERG intensity, where it is longer than normal). The
b-wave latencies (right) are within the normal limits at all
intensities, other than in P1 at 2.44 cd-s/m
2
(log=0.39).
 Figure 2
of Kinori, Mol Vis 2011; 17:2241-2247.
Figure 2
of Kinori, Mol Vis 2011; 17:2241-2247.