Figure 1. Sequence chromatography.
The family number of each proband was shown in the left column.
Sequences with mutations from probands were shown in the middle
and those from normal controls were aligned on the right column.
For families QT456 and QT174, only the mutant sequence of the
proband from family QT456 was shown as both probands had the
same mutation. Each mutation was described under the
corresponding sequence.
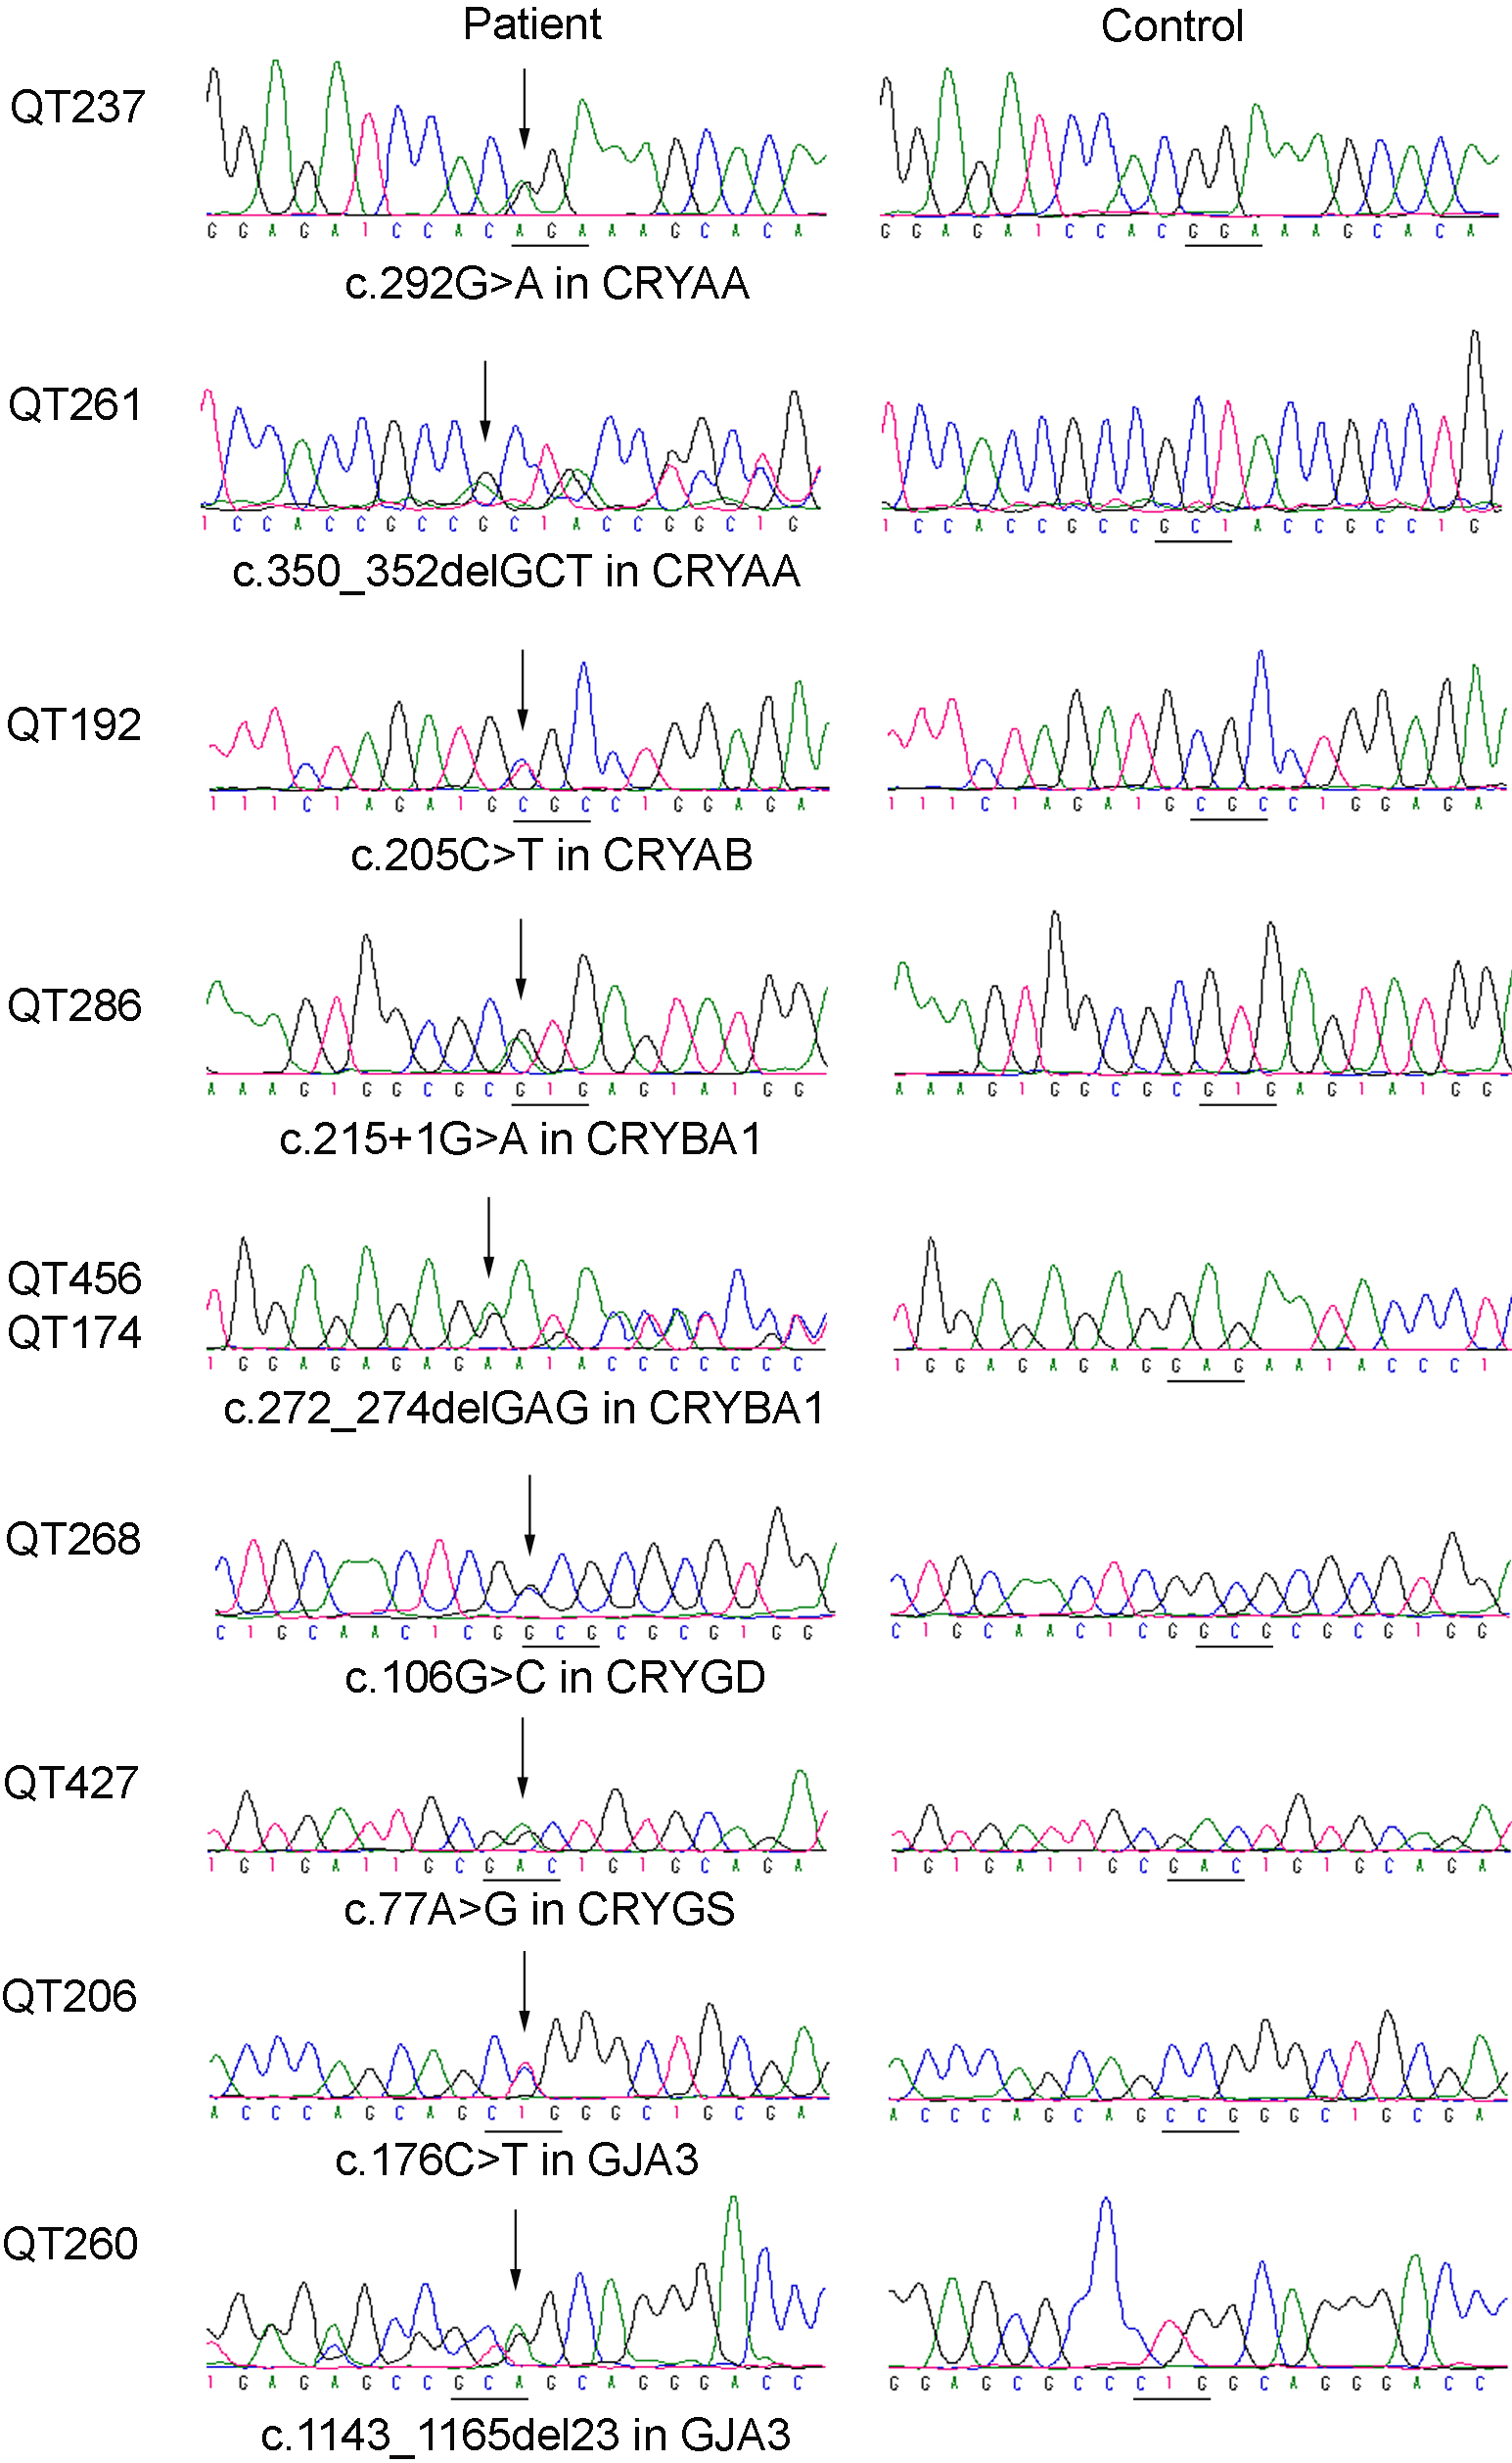
 Figure 1
of Sun, Mol Vis 2011; 17:2197-2206.
Figure 1
of Sun, Mol Vis 2011; 17:2197-2206.