Figure 7. Statistical analysis of
changes in the staining for various markers in the diabetic
limbus in organ culture upon c-met overexpression. Significant
staining increase after c-met gene transduction was
observed for K17, K19, and ΔNp63α. Changes in the expression
levels of K15, N-cadherin and β1 integrin did not
reach significance. Data are mean±SEM. Thirteen pairs of c-met
or vector treated organ cultured diabetic corneas were used.
*p<0.05. Details are in the Methods section.
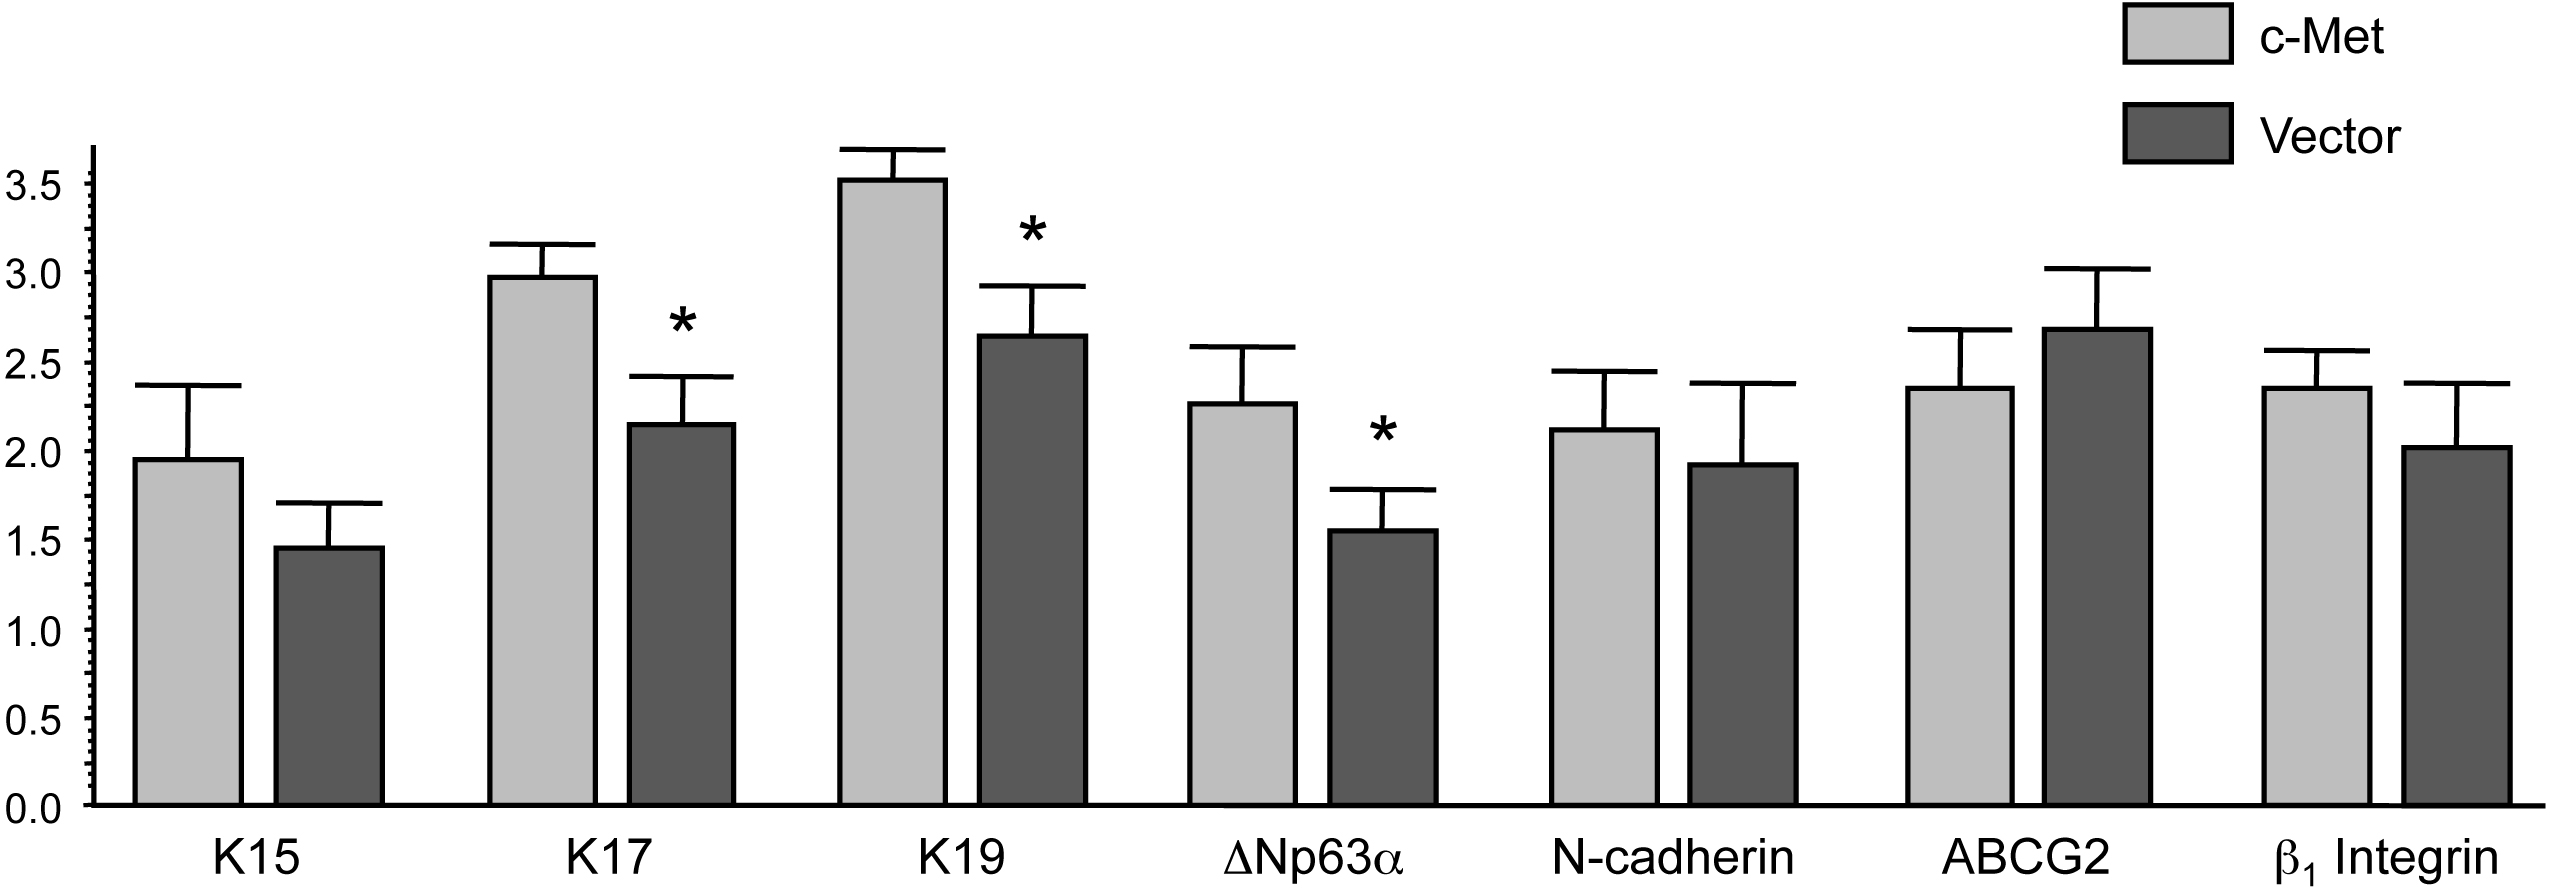
 Figure 7
of Saghizadeh, Mol Vis 2011; 17:2177-2190.
Figure 7
of Saghizadeh, Mol Vis 2011; 17:2177-2190.