Figure 3. Statistical analysis of
changes in the staining for various markers in diabetic versus
normal ex vivo limbus. Significant staining decrease was
observed for K15, K17, K19, ΔNp63α, N-cadherin, ABCG2,
fibronectin, β1 integrin, and laminin γ3 chain. Data
are mean±SEM. Normal, n=15; diabetic, n=13. *p<0.05;
**p<0.01. Details are in the Methods section.
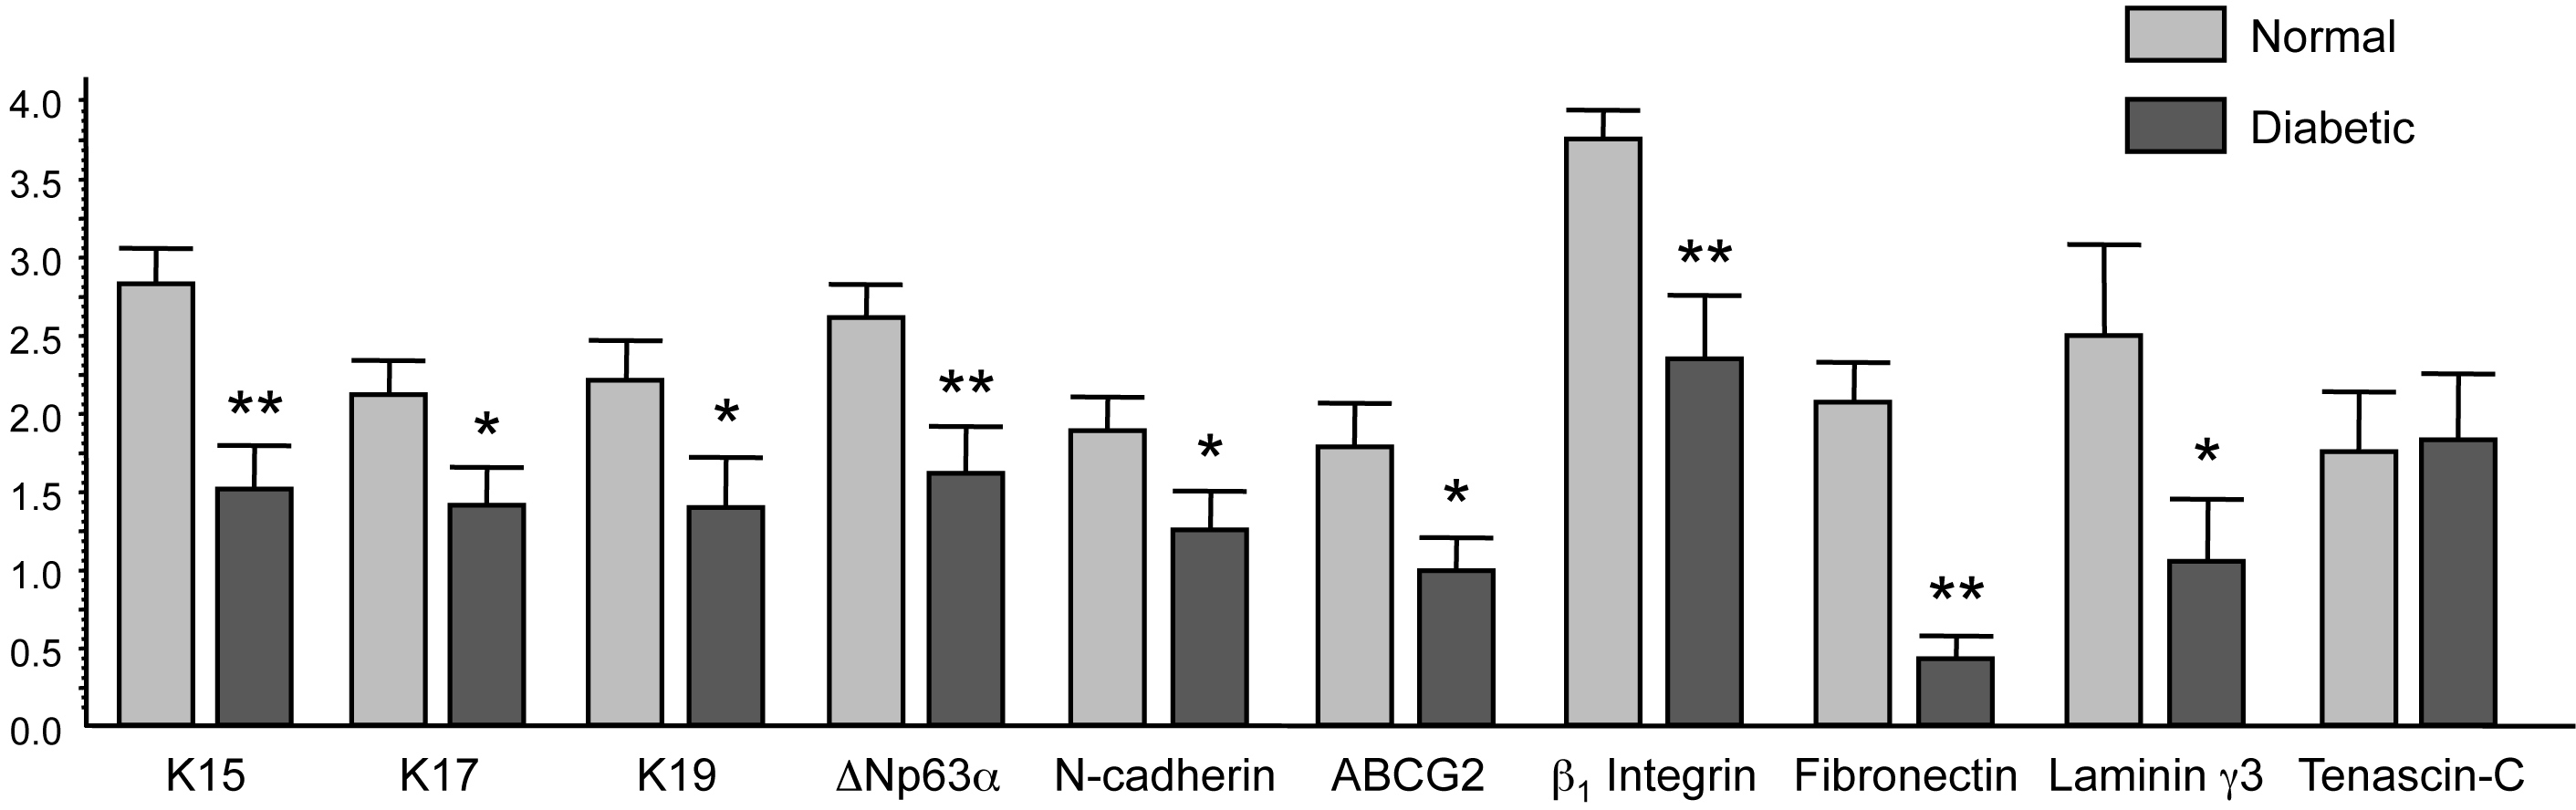
 Figure 3
of Saghizadeh, Mol Vis 2011; 17:2177-2190.
Figure 3
of Saghizadeh, Mol Vis 2011; 17:2177-2190.