Figure 1. Keratin expression patterns in normal and diabetic ex vivo limbus. The staining intensity of K15, K17, and K19 was significantly
decreased in the diabetic limbus. Note a reduction of K17-positive cells in the diabetic limbus as well. Here and in all other
figures, each normal and diabetic pair was photographed at the same exposure times in the same staining experiments. e, epithelium,
s, stroma. Bar=40 μm.
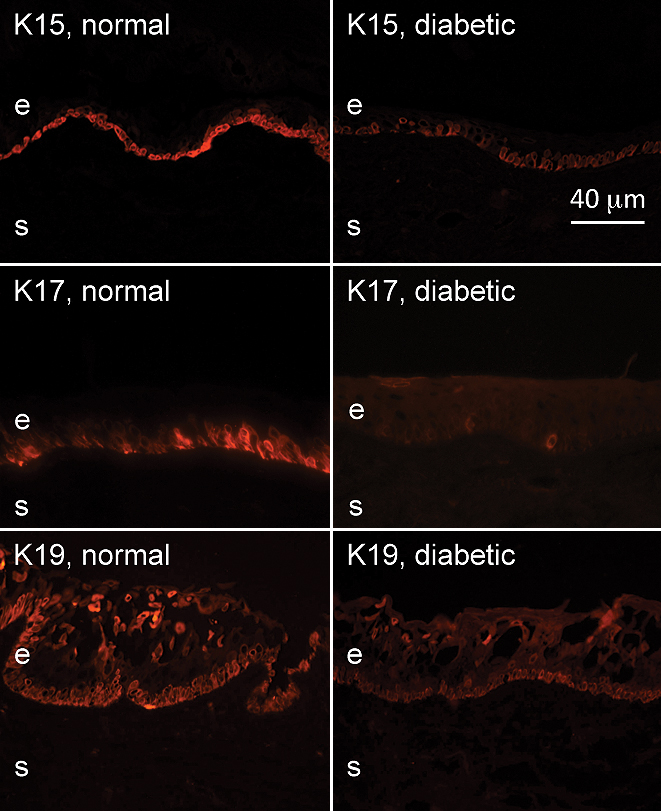
 Figure 1 of
Saghizadeh, Mol Vis 2011; 17:2177-2190.
Figure 1 of
Saghizadeh, Mol Vis 2011; 17:2177-2190.