Figure 4. VEGF expression in the injured corneas of mice. A: Semi-quantitative RT–PCR to evaluate mRNA expression of VEGF. Corneas were harvested at the indicated time points, and five corneas at each time point were pooled to extract total RNAs.
RT–PCR was performed using the obtained total RNAs. Representative results from three independent are shown here. B: The ratios of VEGF to Actb mRNA were determined on vehicle- (open bars) and SDF-1α-treated BABL/c mice (black bars). All values represent mean±SEM of
three to five independent measurements. C: Protein extracts were obtained and subjected to western blotting analysis. Representative results from three independent
experiments are shown here. D: Ratios of VEGF to β-actin protein bands of vehicle- (open bars) and SDF-1α-treated mice (black bars) were determined as
described in Methods. All values represent mean±SEM (n=5–8 animals). *, p<0.05 and #, p<0.01 compared with vehicle-treated mice.
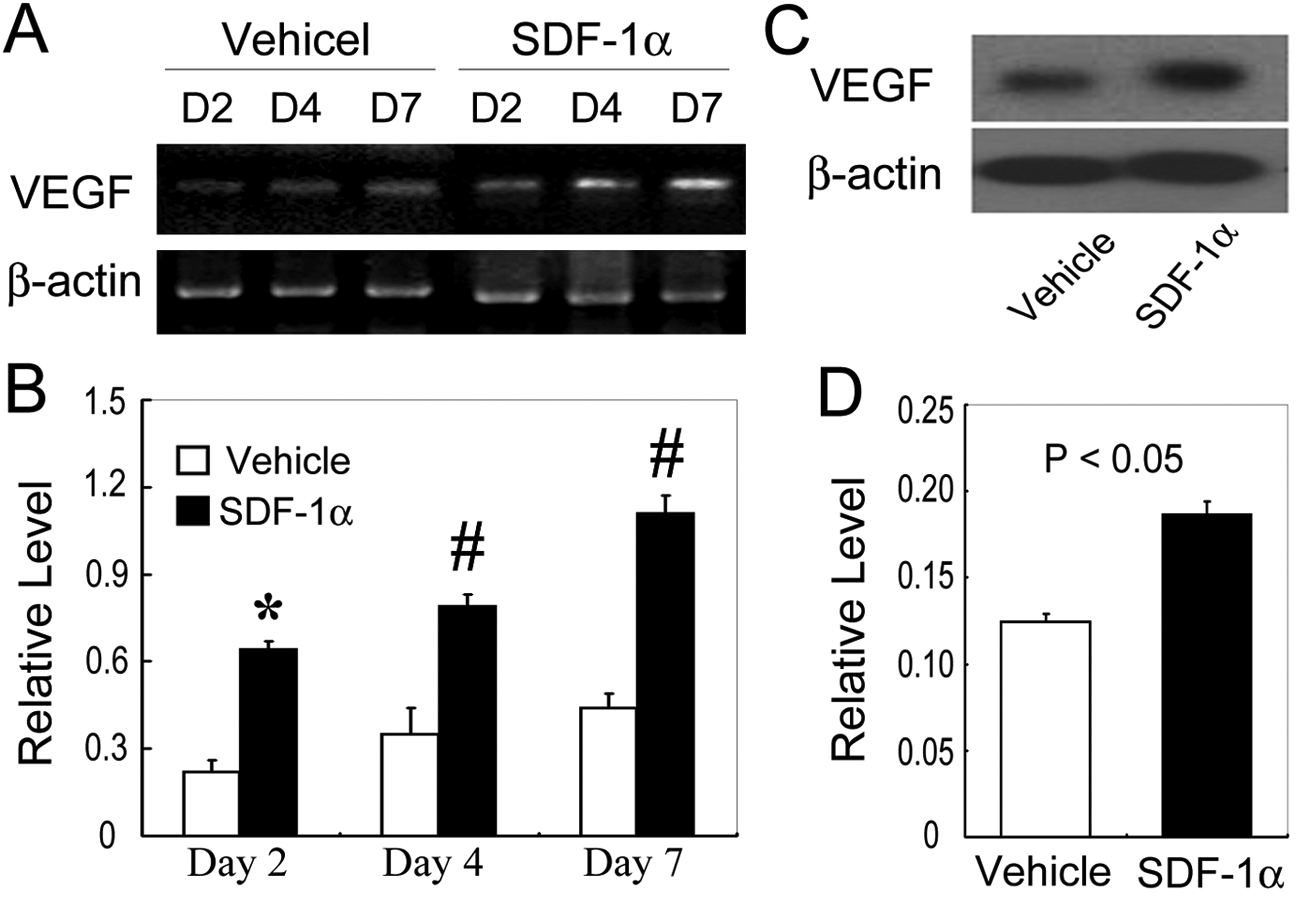
 Figure 4 of
Liu, Mol Vis 2011; 17:2129-2138.
Figure 4 of
Liu, Mol Vis 2011; 17:2129-2138.