Figure 4. Networks generated by IPA
related to drug metabolism, small molecule biochemistry and cell
morphology and to cancer, cell cycle, skeletal and muscular
disorders. Drug metabolism, small molecule biochemistry and cell
morphology network (A), and cancer, cell cycle, skeletal
and muscular disorders network (B) generated by IPA. The
network contained nodes (gene/gene product) and edges
(indicating a relationship between the nodes) showing the
cellular/subcellular location as indicated. Function classes of
nodes were indicated by shape to represent functional class.
Colored molecules represented genes that appeared in the data
set studied. Red and green molecules were upregulated and
down-regulated, respectively, in limbal epithelial cells. Gray
molecules did not meet the user defined cutoff of 2. White
indicated the molecule was added from the IPKB.
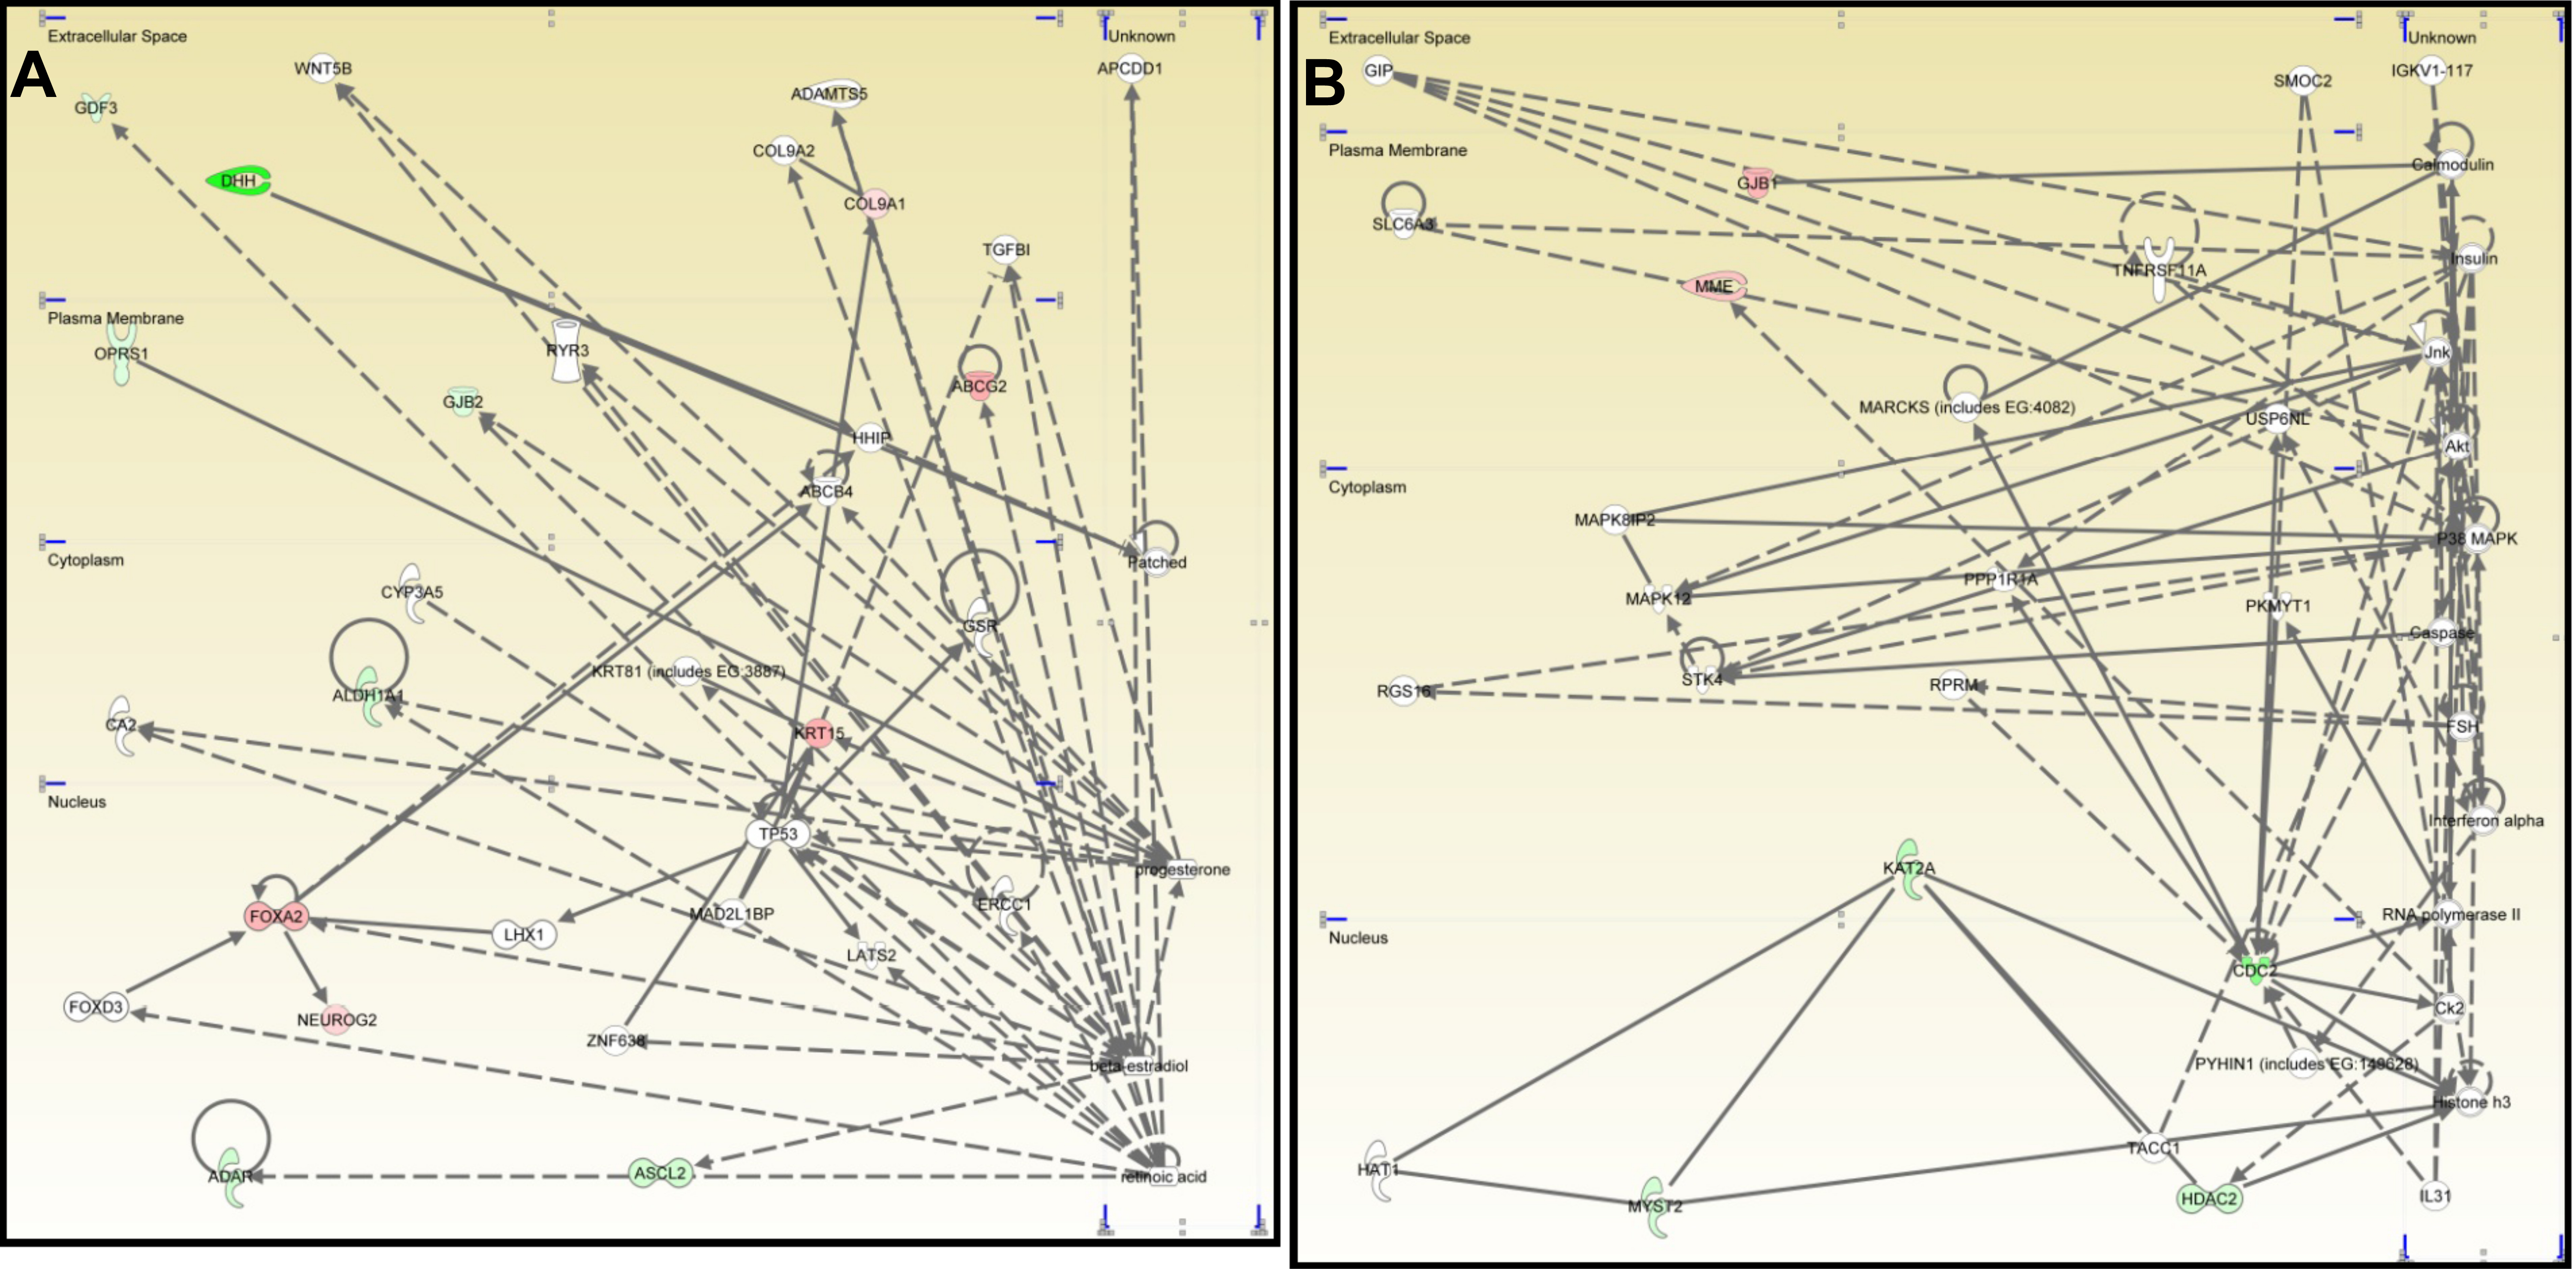
 Figure 4
of Nieto-Miguel, Mol Vis 2011; 17:2102-2117.
Figure 4
of Nieto-Miguel, Mol Vis 2011; 17:2102-2117.