Figure 2. Wnt/β-catenin signaling
pathway generated by Ingenuity Pathway Analysis (IPA). The IPA
depicted the genes involved, their interactions, and the
cellular and metabolic reactions that constituted the pathway.
Colored molecules represented genes that appeared in the data
set studied. Red and green molecules were up- and
down-regulated, respectively, in limbal epithelial cells. Gray
molecules did not meet the user defined cutoff of 2.
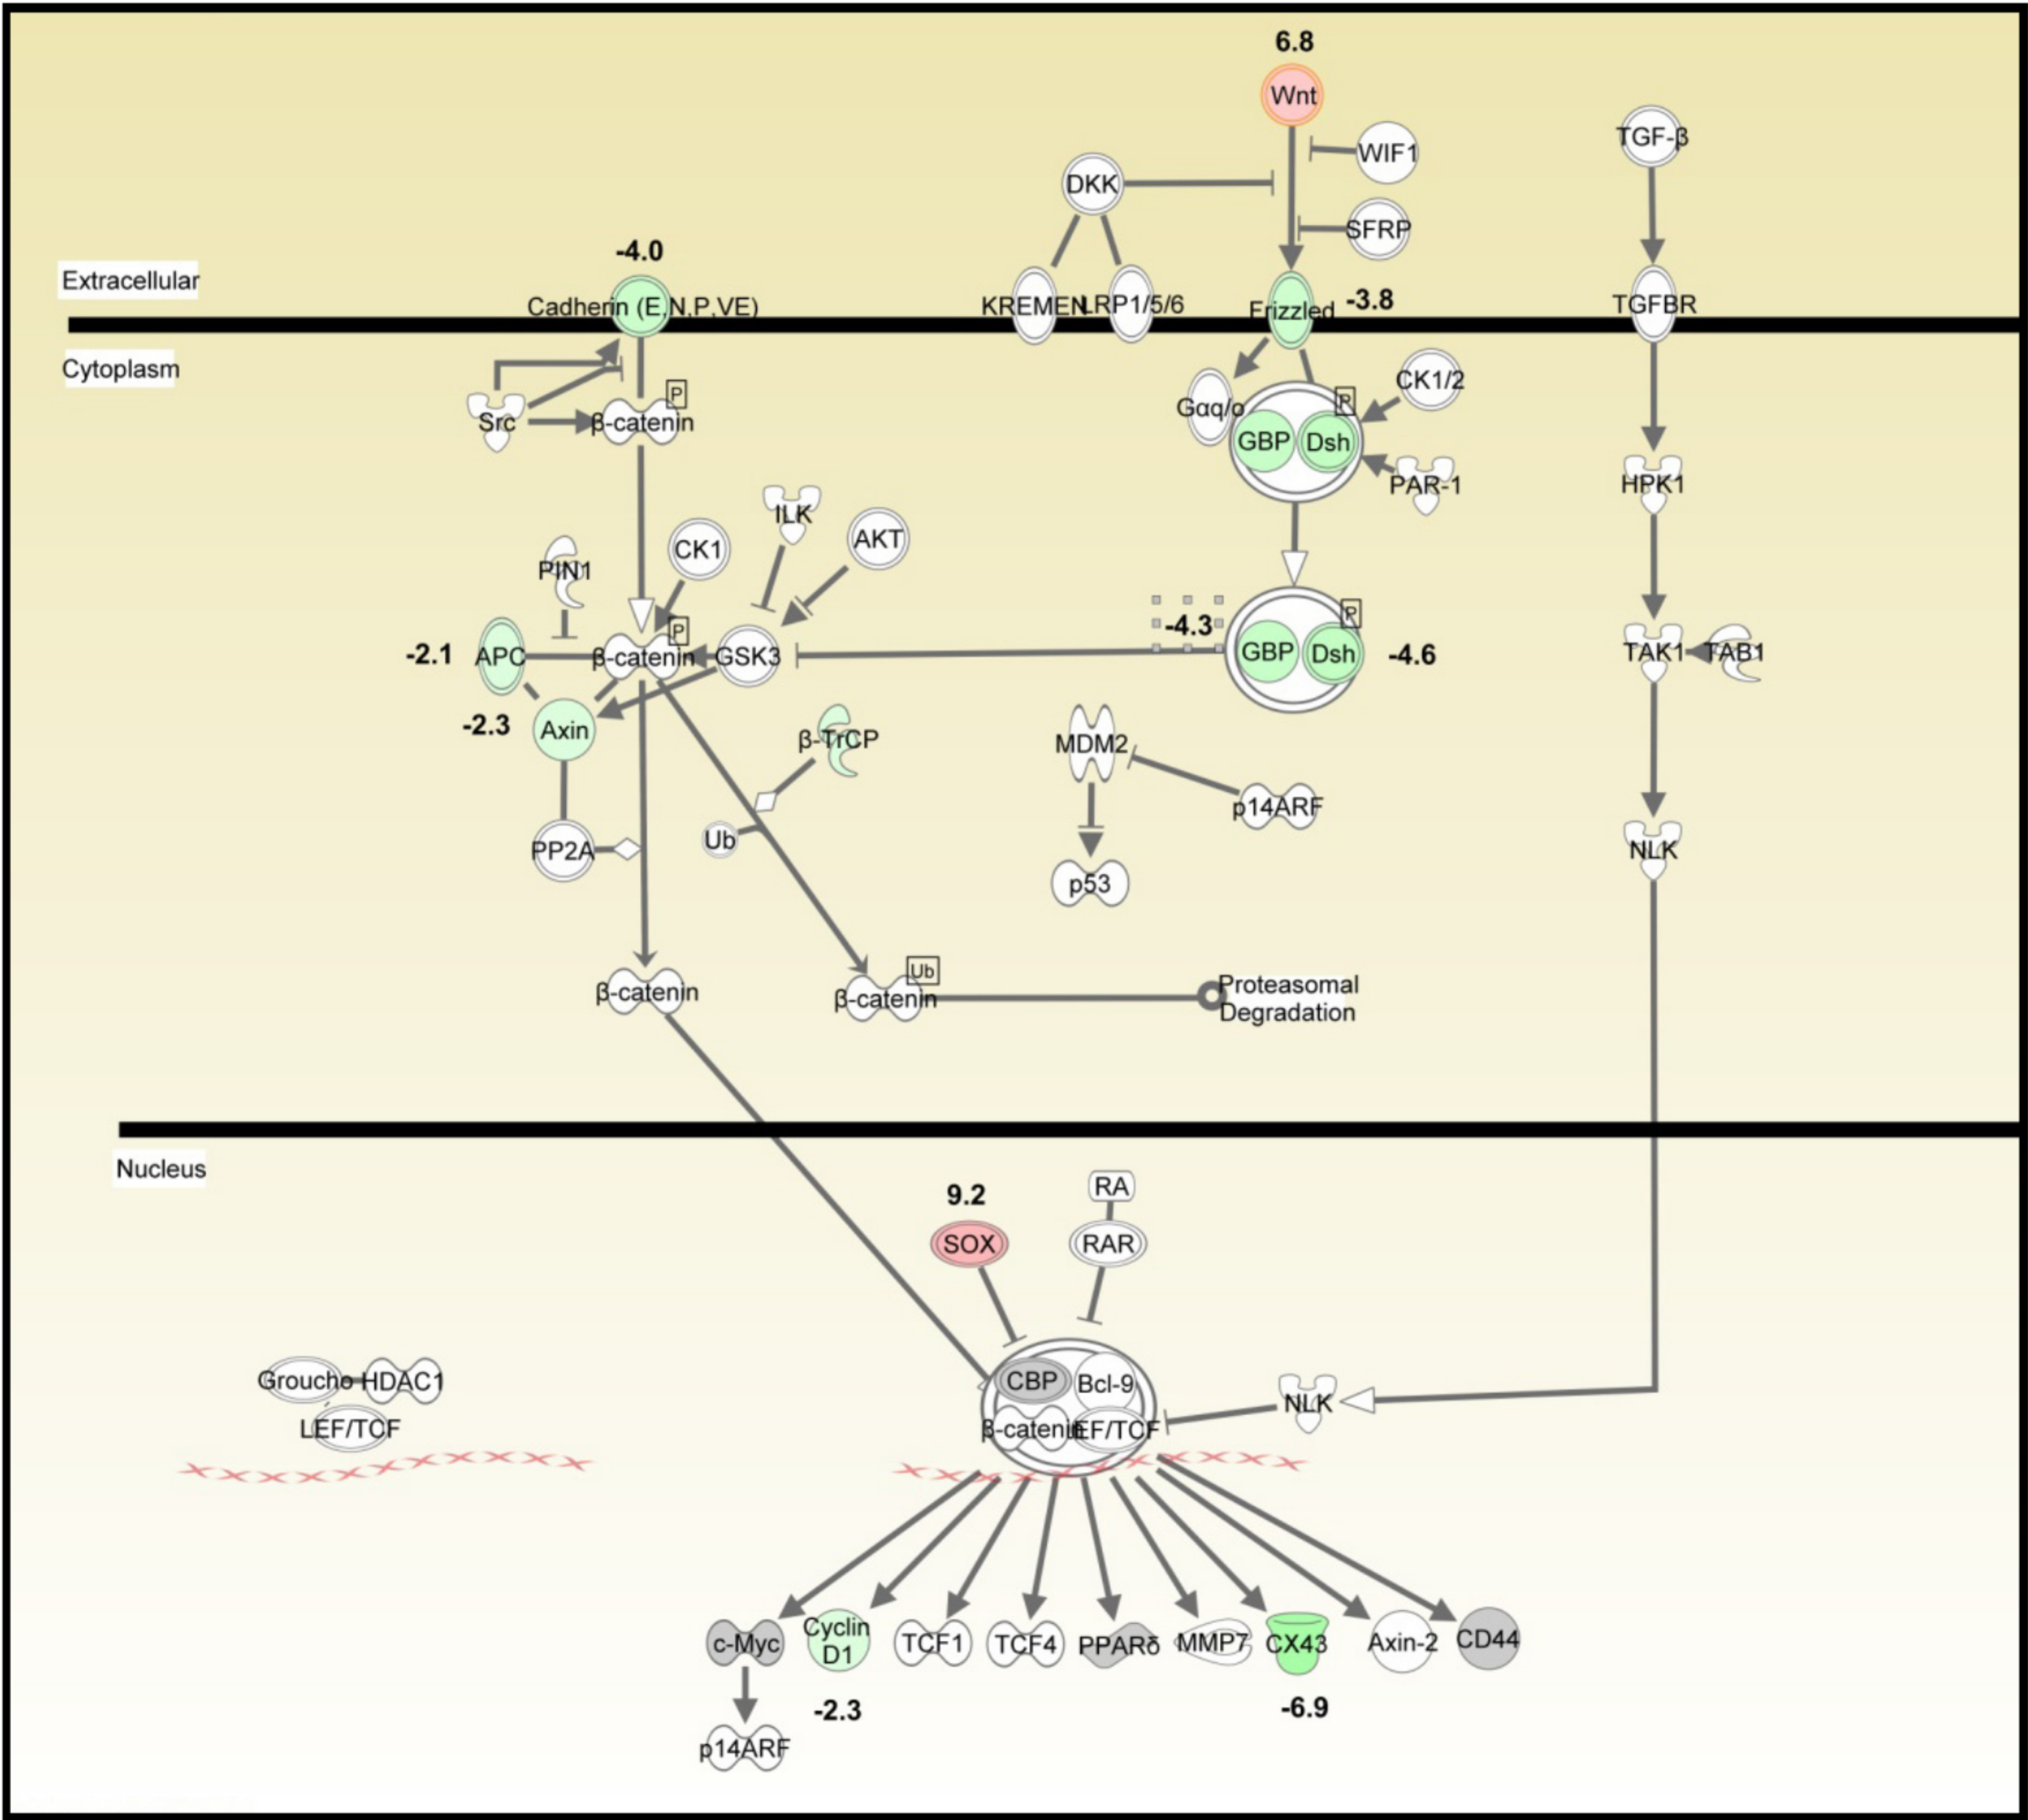
 Figure 2
of Nieto-Miguel, Mol Vis 2011; 17:2102-2117.
Figure 2
of Nieto-Miguel, Mol Vis 2011; 17:2102-2117.