Figure 2. Scatter plots comparing the
copy number estimates determined for the second and third MLPA
assay on all subjects. Panel A shows the results for CFHR3,
Panel B for CFHR1, and Panel C for CFHR4.
The scatter plots show that the MLPA ratio criteria for
homozygous deletion is 0.00 to 0.40, for heterozygous deletion
is 0.41 to 0.80, for wild-type is 0.81 to 1.60, and for
heterozygous duplication is >1.60. The largest cluster in
each panel represents two copies, the second largest cluster one
copy, and the subjects on the y-axis in panels A
and B zero copies.
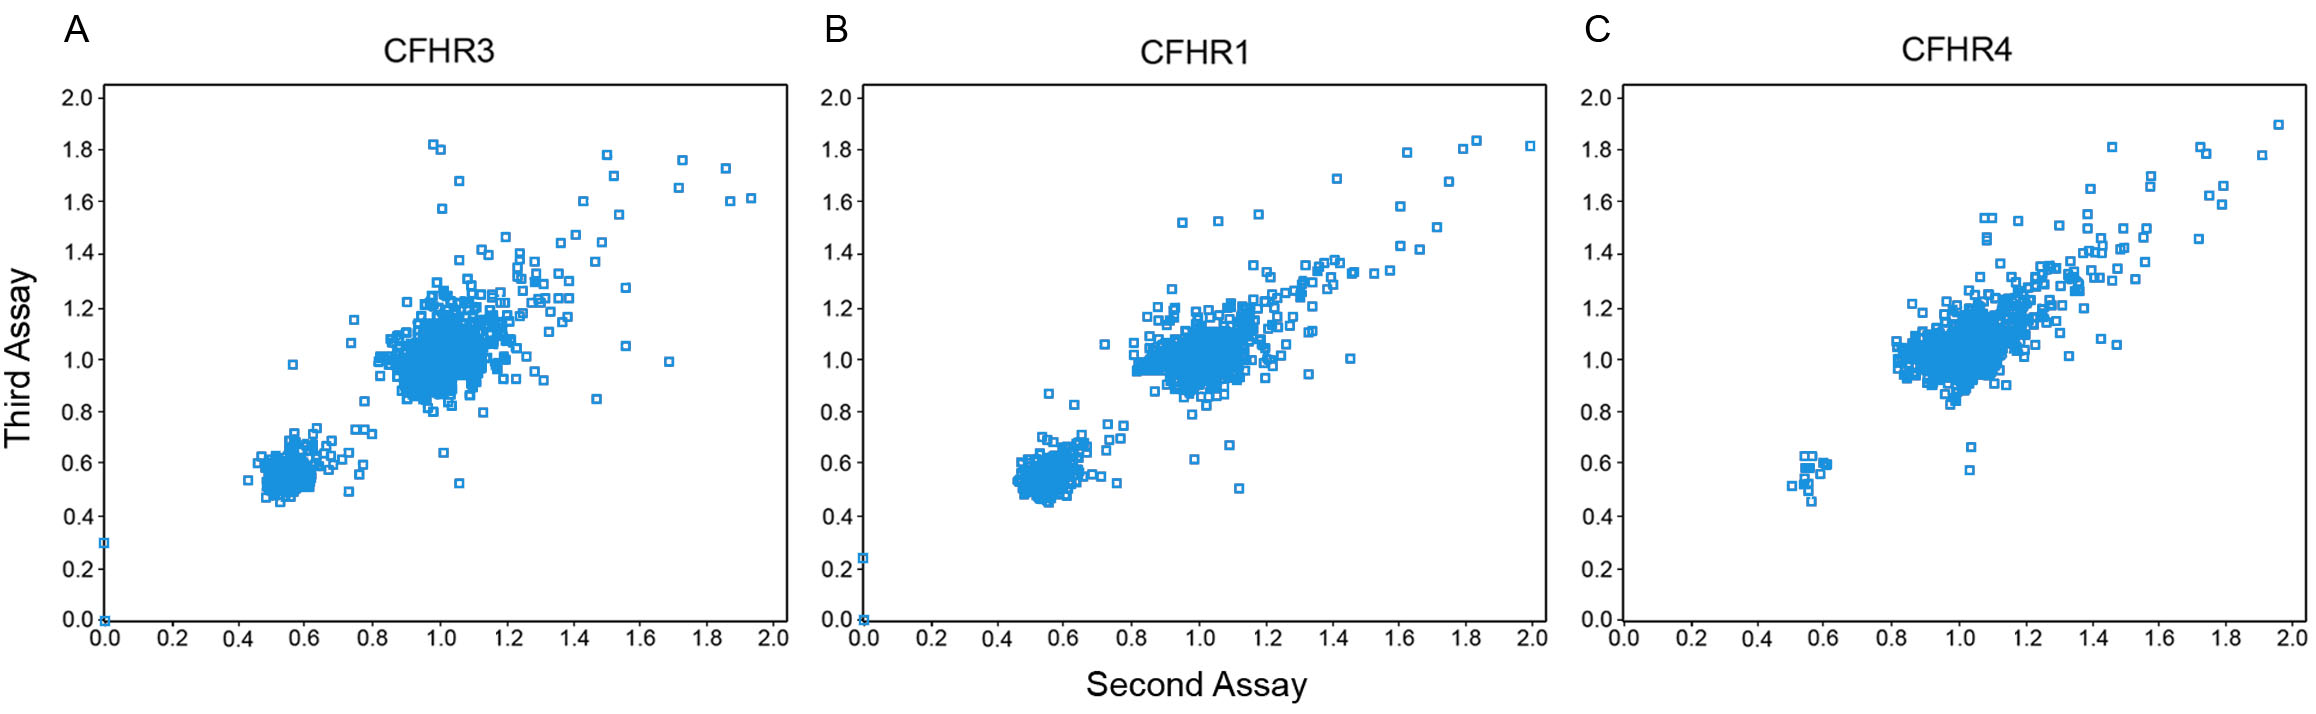
 Figure 2
of Kubista, Mol Vis 2011; 17:2080-2092.
Figure 2
of Kubista, Mol Vis 2011; 17:2080-2092.