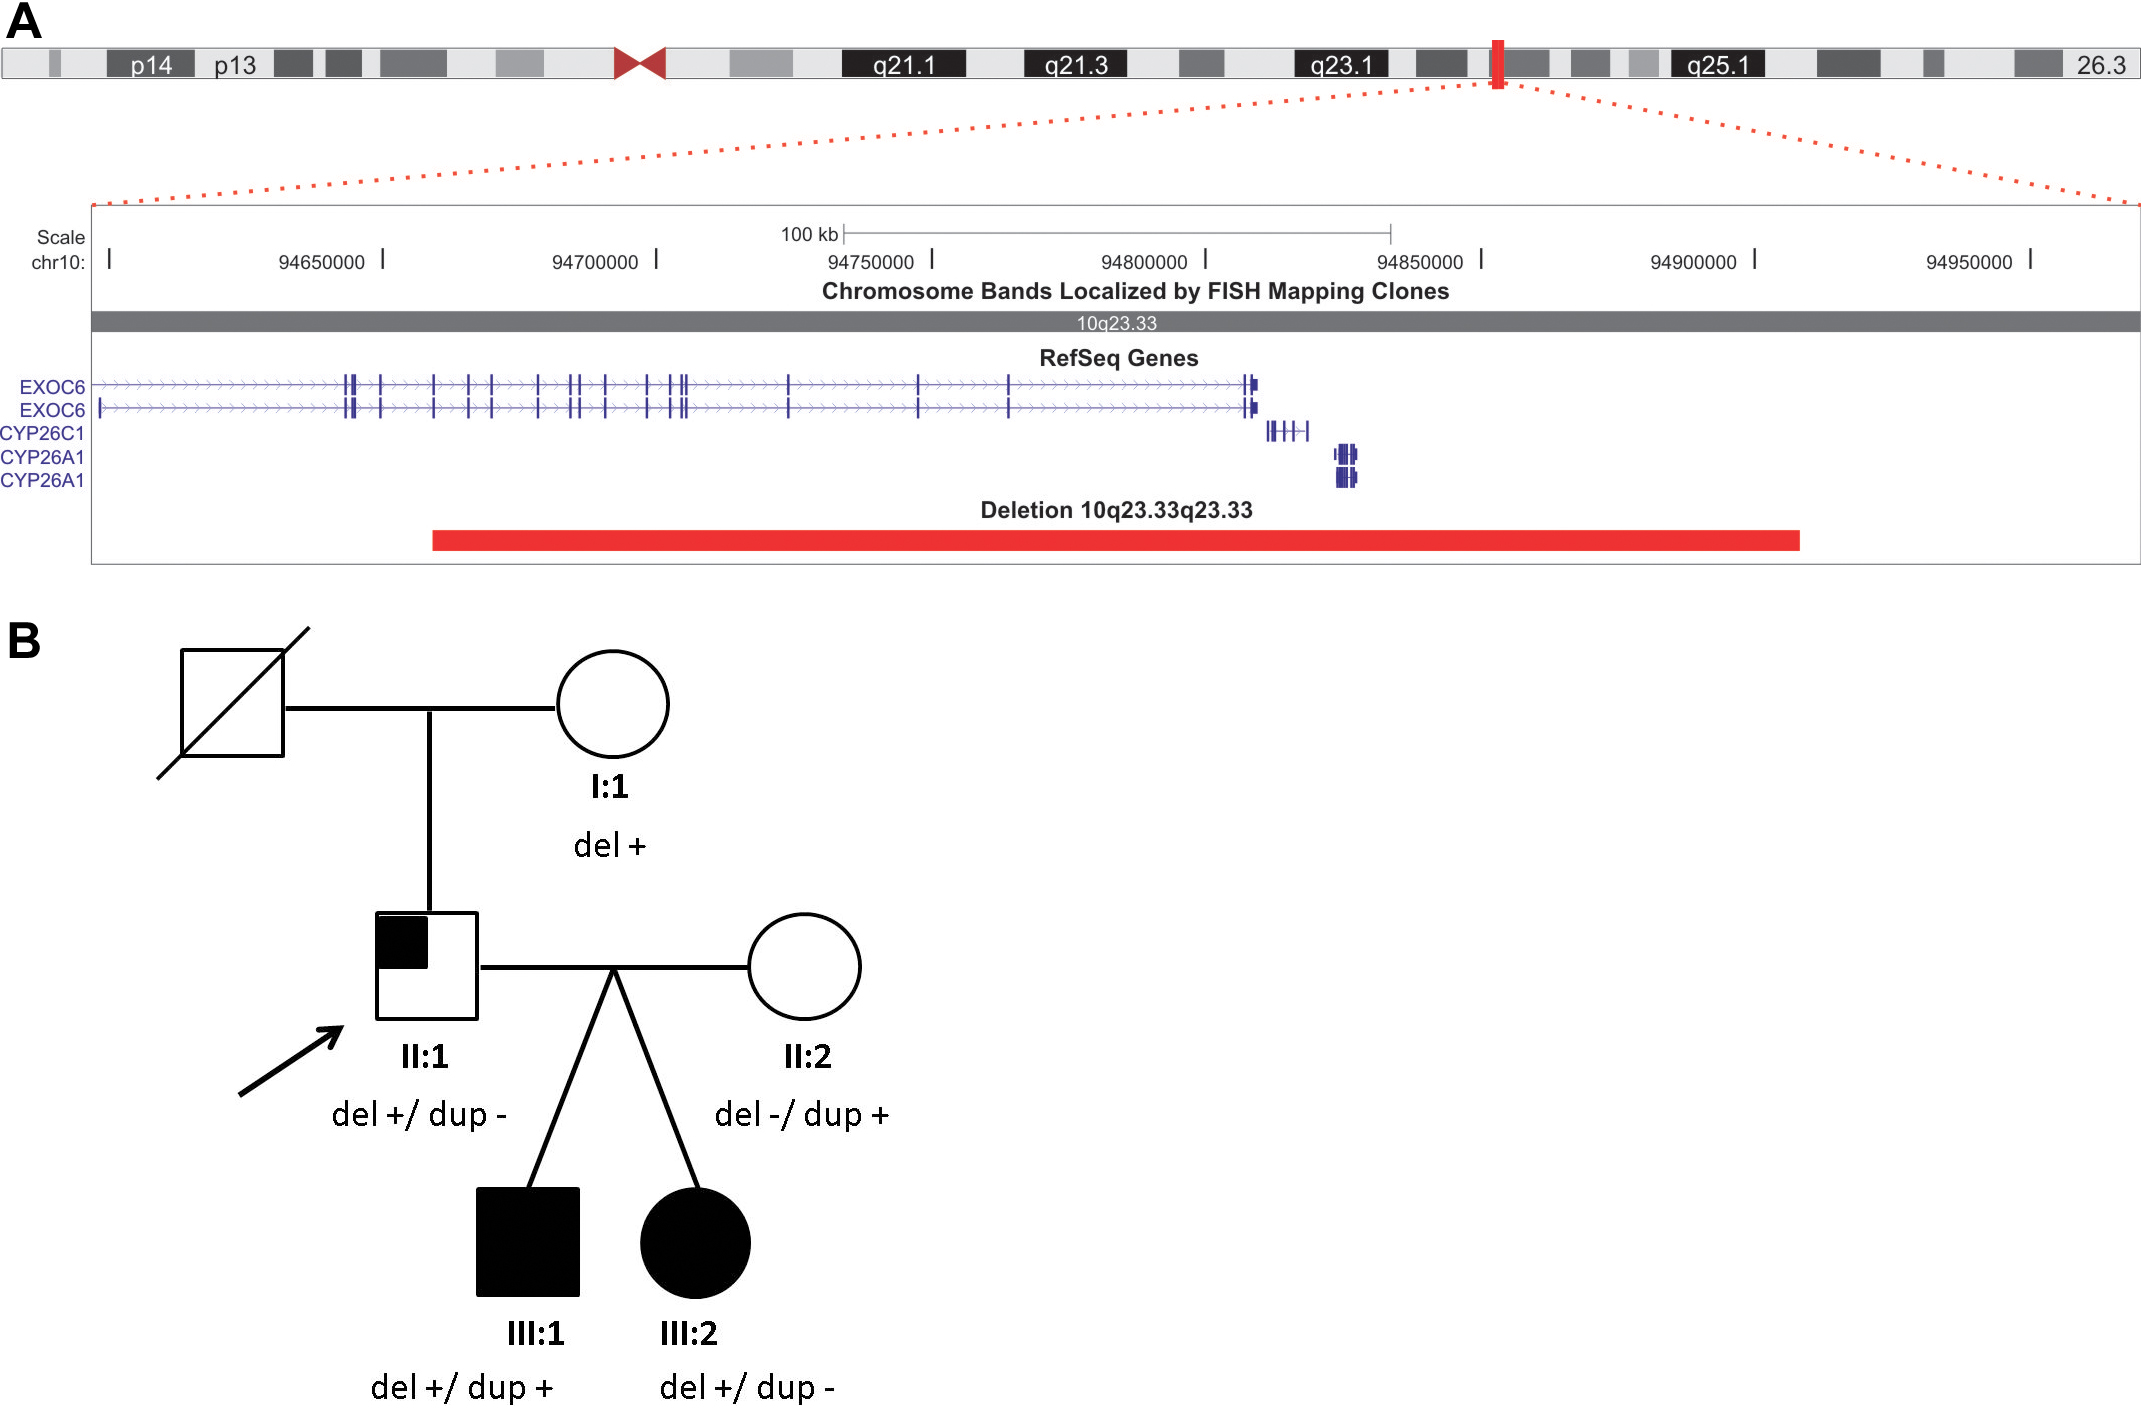
Figure 3. UCSC track of the 10q
microdeletion. A: The 10q23.33q23.33 track shows the
extent of the249–363 kb deletion of chromosome band
10q23.33q23.33 (arr 10q23.33q23.33(94659243–94908060)x1 pat
10q23.33q23.33. The location and size of the deletion are
indicated by a horizontal red bar. The figure was drawn
according to the UCSC, Human Genome Browser, March 2006
(NCBI36/hg18). B: The three-generation pedigree
represents the unaffected grandmother (I:1), affected father
(II:1), and twins (III:1 and III:2) carrying the 10q23 deletion.
Del: deletion of 10q23.33q23.33; dup: duplication of
2p16.2p16.2. Filled symbol: bilateral optic nerve aplasia (ONA).
Partially filled symbol: unilateral ONA.

 Figure 3
of Meire, Mol Vis 2011; 17:2072-2079.
  Figure 3
of Meire, Mol Vis 2011; 17:2072-2079.