Figure 2. The confidence ellipse of PCA
scores plots. A: PCA scores plots of 1H-NMR spectrum between
the TA group (◇) and the TA+GL group (■), one day post-injection. B:
PCA
scores
plots
of 1H NMR spectrum between the TA group (◆) and the
TA+GL group (△), 28 days post-injection.
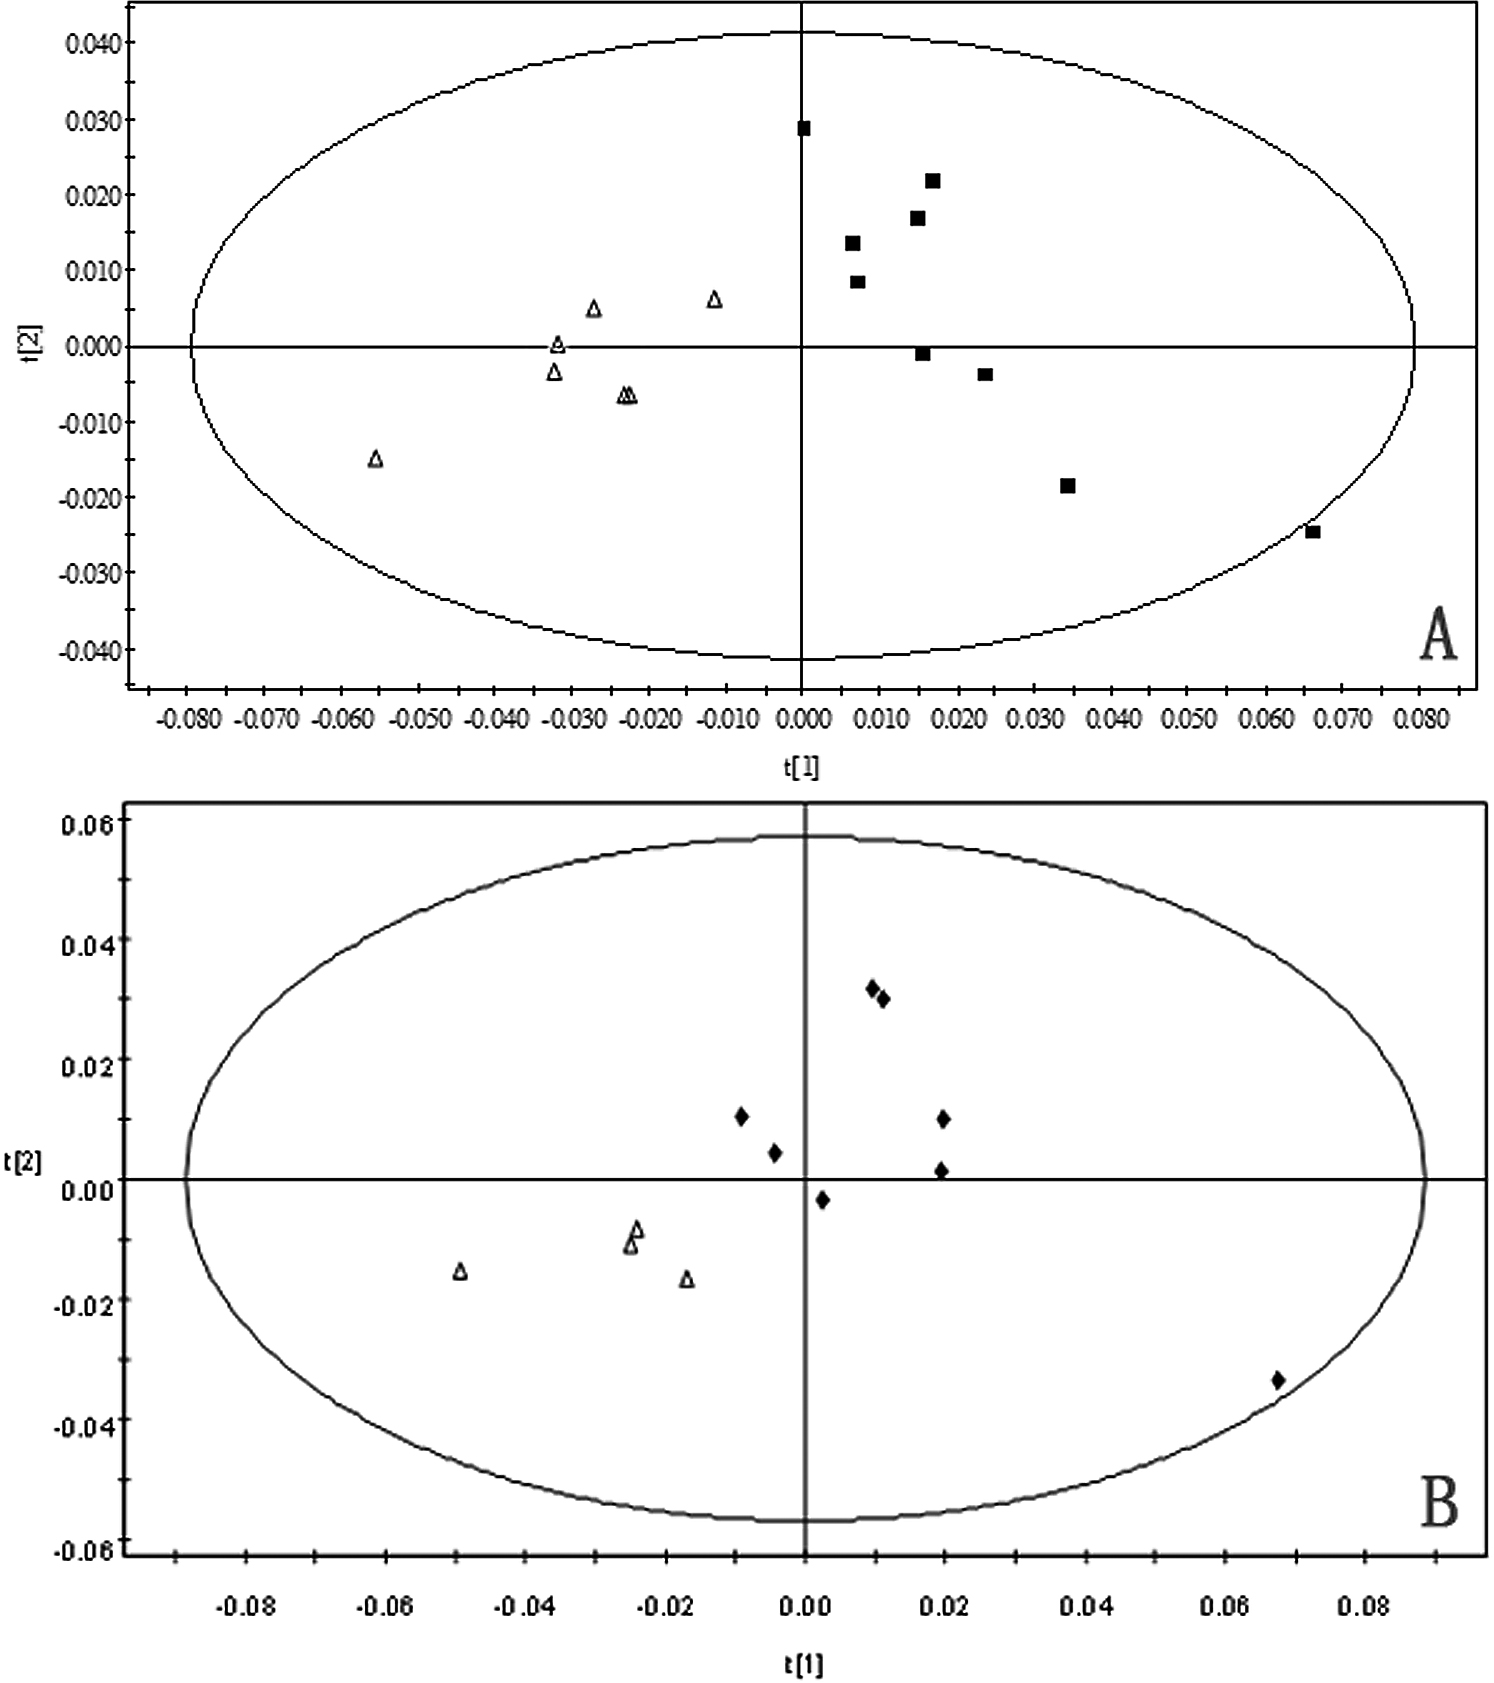
 Figure 2 of Song, Mol Vis 2011; 17:2056-2064.