Figure 3. Results of the multipoint nonparametric linkage analysis for family HM-32. The x-axis represents the chromosomal location
for each of the 22 autosomes, and the y-axis represents the Z mean/LOD. The highest peak are at chromosome 7p22.1–7p21.1 (nonparametric
linkage [NPL] 8.26; p=0.006), 7p12.3–7p11.2 ([NPL] 8.23; p=0.006), and 12p12.3–12p12.1 ([NPL] 8.02; p=0.006).
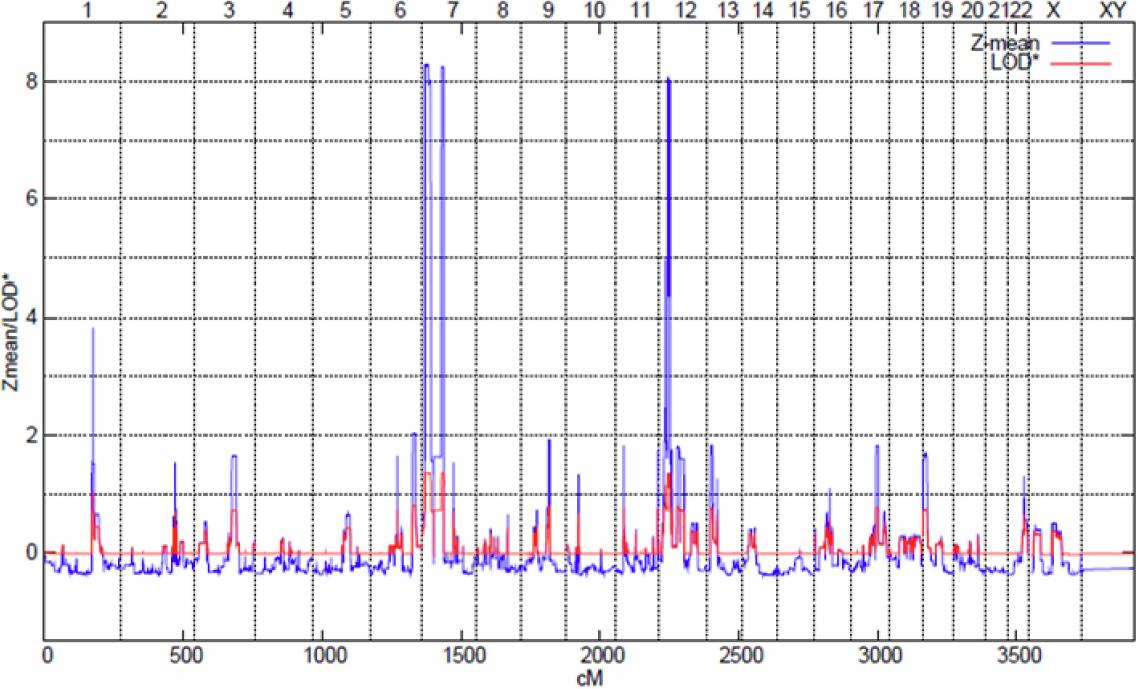
 Figure 3 of
Rydzanicz, Mol Vis 2011; 17:2028-2039.
Figure 3 of
Rydzanicz, Mol Vis 2011; 17:2028-2039.