Figure 2. Dotplot graphs showing aqueous humor concentrations of IL-1β, IL-6, IL-8, IL-10, IL-12p70, and CCL2/MCP-1 in all patients
with IU and in the controls. Statistical significances are indicated at the top (Mann–Whitney U-test). The horizontal lines represent the geometric means.
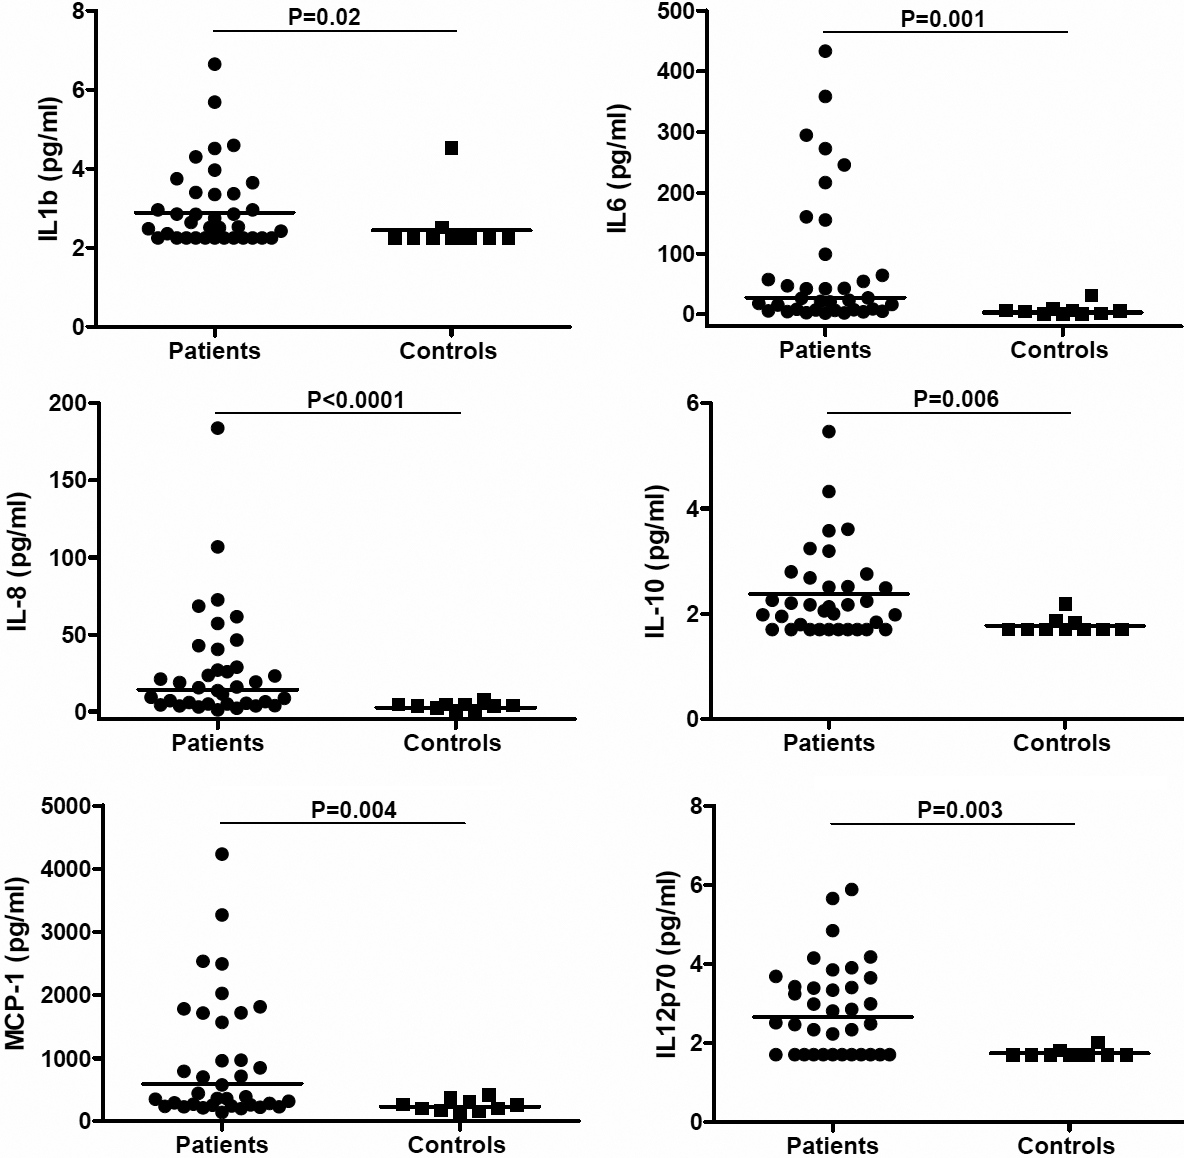
 Figure 2 of
Valentincic, Mol Vis 2011; 17:2003-2010.
Figure 2 of
Valentincic, Mol Vis 2011; 17:2003-2010.