Figure 1 of
Valentincic, Mol Vis 2011; 17:2003-2010.
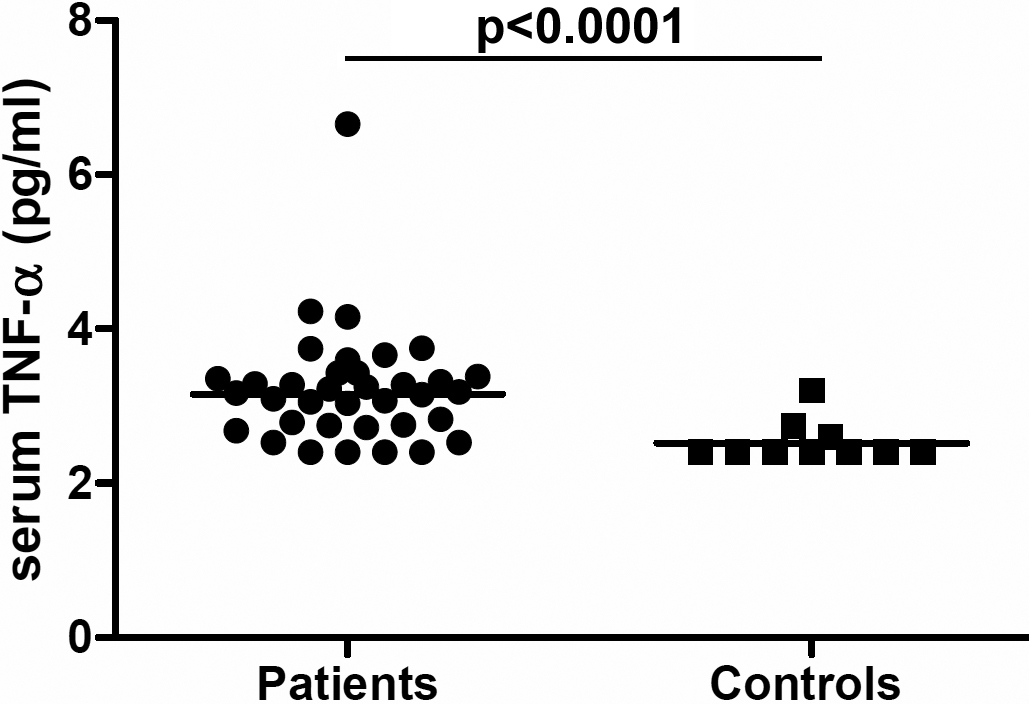
Figure 1.
Dotplot graph showing serum concentrations of TNF-α in all patients with IU and in the control group. Statistical significance is indicated at the top (Mann–Whitney
U
-test). The horizontal line represents the geometric mean.
 Figure 1 of
Valentincic, Mol Vis 2011; 17:2003-2010.
Figure 1 of
Valentincic, Mol Vis 2011; 17:2003-2010.