Figure 2. Pedigree diagrams of the three
participating families. Circles represent females, squares males and
rhombi offspring of unknown sex. Filled symbols indicate clinically
affected individuals. HGPPS-patients are marked by arrows: patient 1
(II.1) and patient 2 (II.2) in A, patient 3 (II.1) in B
and patient 4 (II.1) in C. All patients were born to
consanguineous parents.
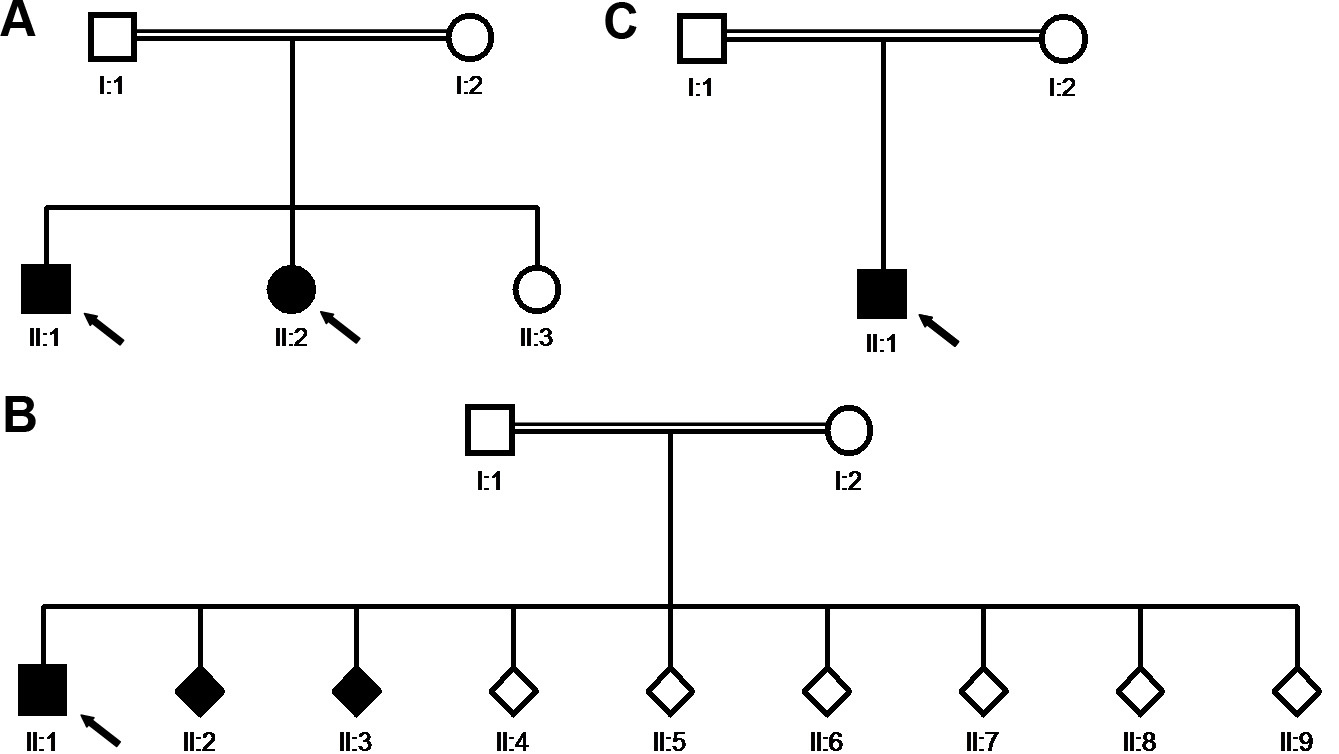
 Figure 2 of Volk, Mol Vis 2011; 17:1978-1986.