Figure 2. A structural analysis of CYP4V2
WT, MT1, and MT2. A: Homology model of WT- CYP4V2. B:
Backbone superimposition of WT (cyan) with MT1 (Red), the altered
secondary structures are shown in zoom view. C: Backbone
superimposition of WT (cyan) with MT2 (Blue), the truncated region of
MT2 in comparison with WT is shown in zoom view. D:
Superimposed view of heme binding residues in WT (E329, C467) compared
with MT1 (E329, C467). E: Superimposed view of heme binding
residues in WT (E329, C467) compared with MT2 (E329). F, G,
H: Electrostatic potential difference (scale: −2 to 2) in WT,
MT1, and MT2, respectively. The blue color denotes a positive charge
and red denotes a negative charge (the intensity of the shades are
directly proportional to the charge levels).
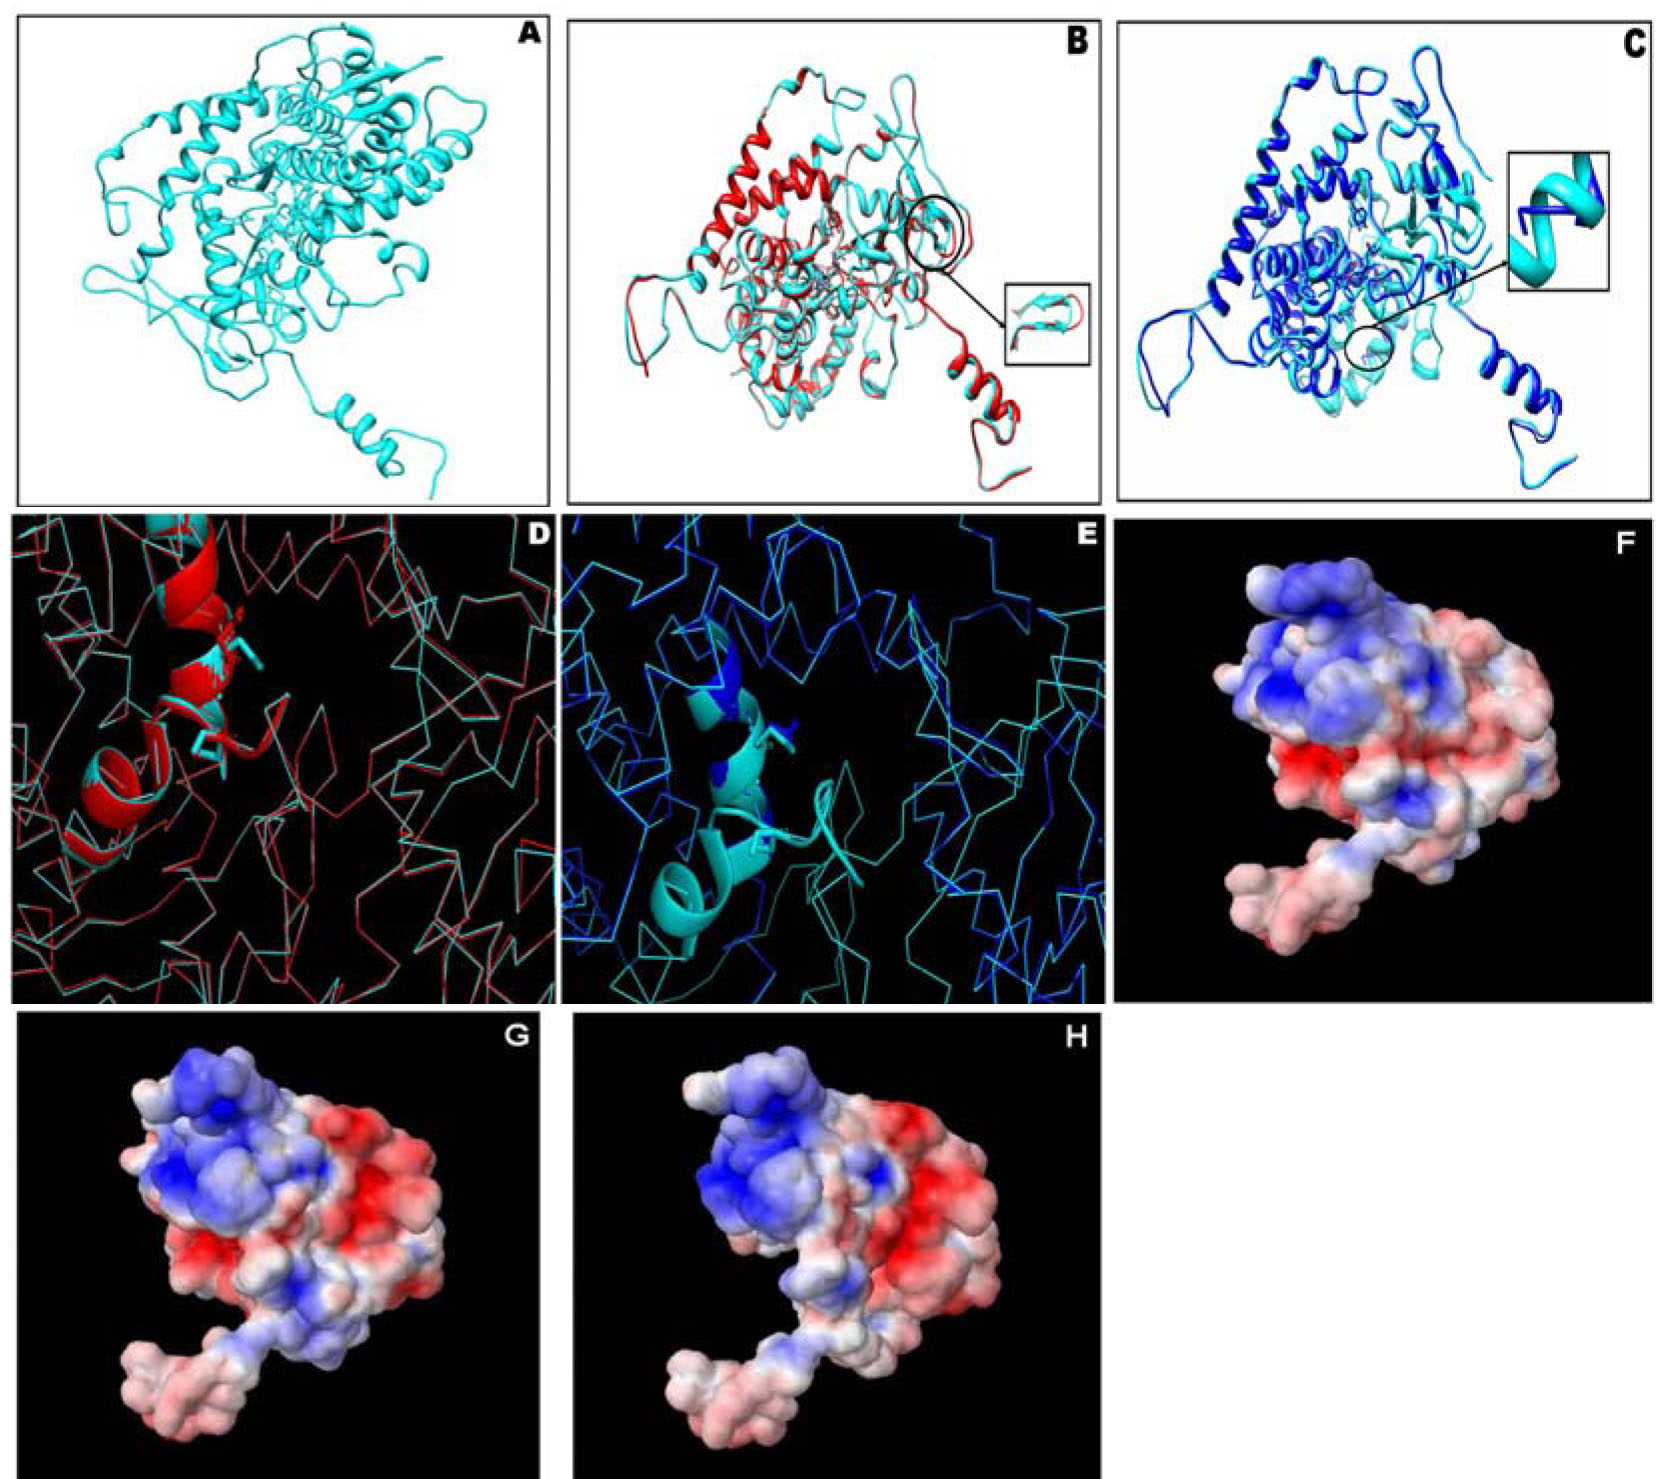
 Figure 2 of Mamatha, Mol Vis 2011; 17:1970-1977.