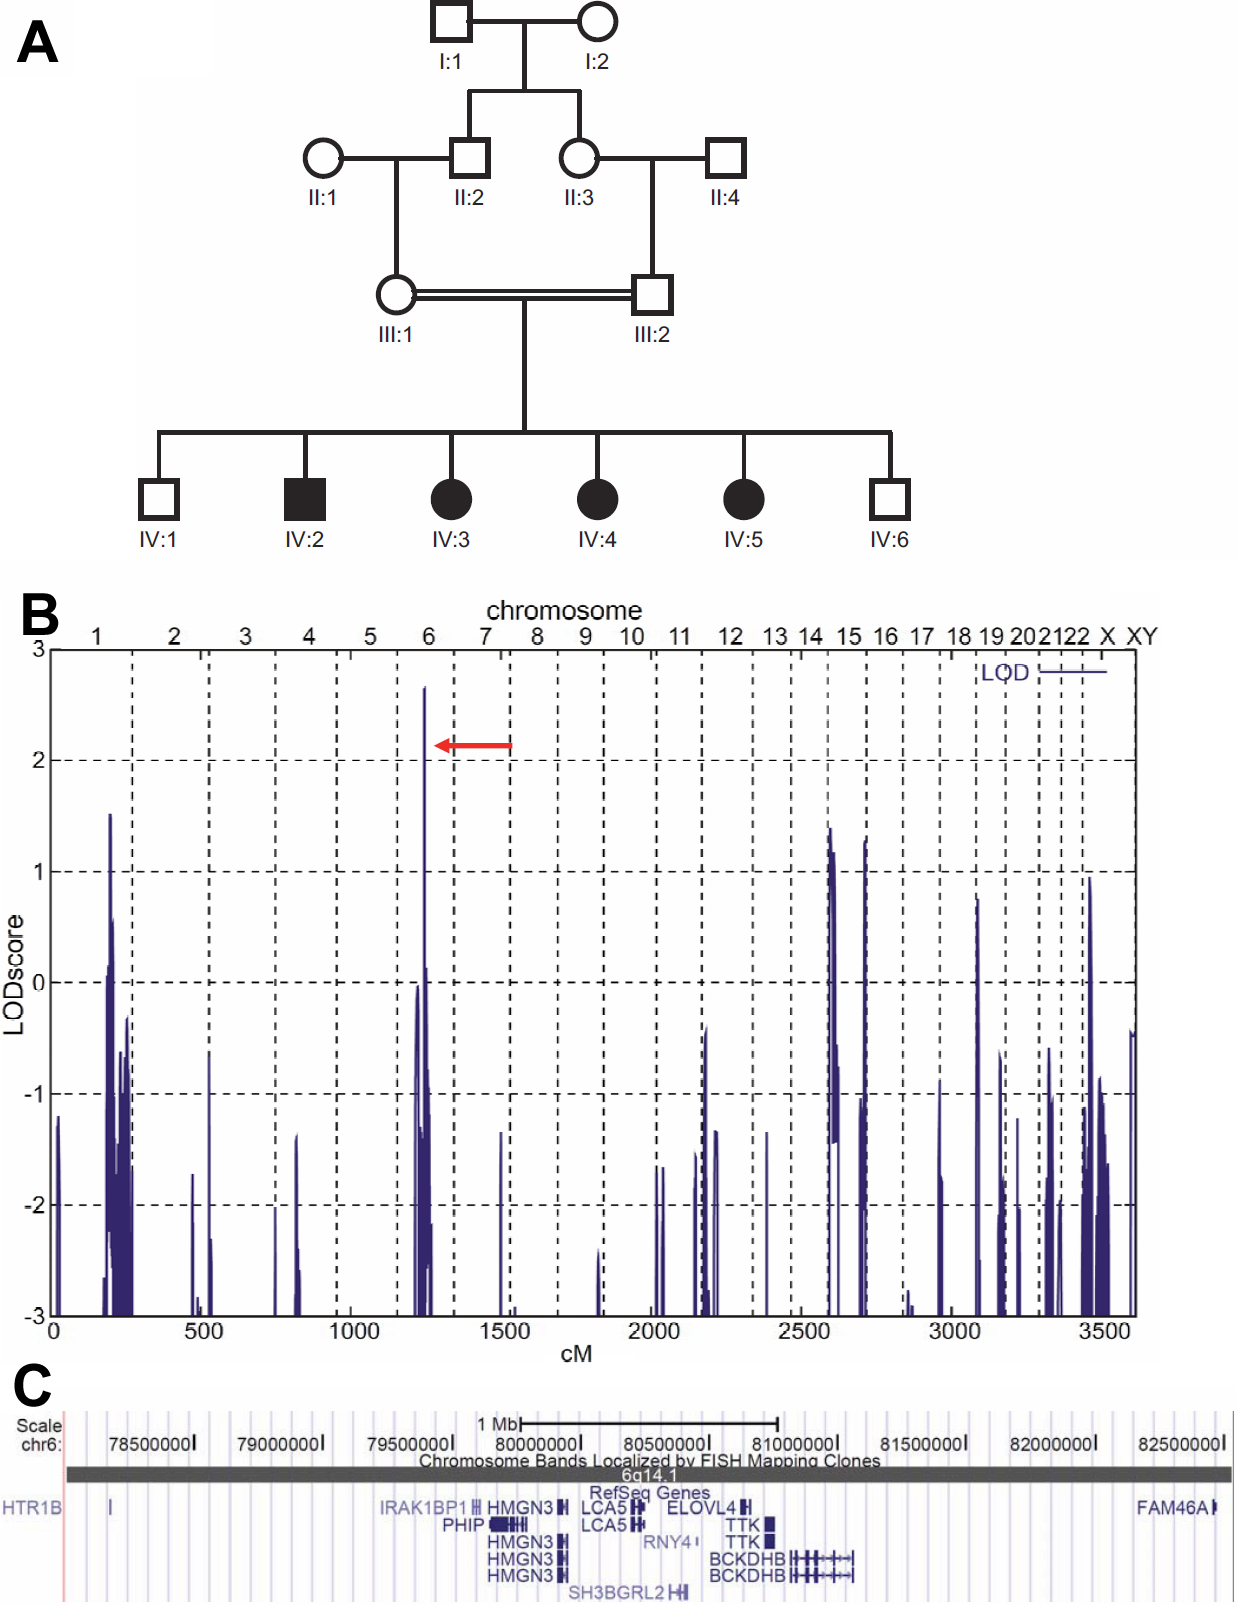
Figure 1. Genetic analysis of LCA family BUIT-LA01.
A: Family pedigree. Circles, females; squares, males. Black symbols, affected. Double horizontal line indicates consanguinity.
The sample of IV:5 was not subjected to genomewide SNP mapping because this sample was initially not available.
B: Graphical view of LOD score calculations of genomewide SNP mapping in the BUIT-LA01 family. LOD scores calculated with ALLEGRO
are given along the y-axis relative to genomic position in cM (centi Morgan) on the x-axis. Note the highest peak in the region
on chromosome 6 (LOD=2.66).
C: Corresponding disease gene locus on chromosome 6q14.1 (4.5 Mb region, only 11 annotated genes;
UCSC genome browser).
 Figure 1 of
Ahmad, Mol Vis 2011; 17:1940-1945.
Figure 1 of
Ahmad, Mol Vis 2011; 17:1940-1945.