Figure 4. Photographs of the optic discs,
visual fields and OCT of the subject IV-2. Optic disc photographs show
a cup-to-disc ratio of 0.5 in the right eye and 0.2 in the left eye (A
and B). The arrow shows the slight loss of the neuroretinal rim
in the inferior temporal optic disc sector of the right eye (A).
The visual field showed a superior and inferior nasal depression in the
right eye (C) and a superior nasal step in the left eye (D).
The
continuous black line represents the thickness of the RNFL of the
right eye (E) and the dashed line the left eye (F). The
bottom of the OCT image shows the RNFL thickness and superior
image-related patient data (black line) with normative data obtained
from a normal population (E and F). In both eyes, the
black line is located within the green band, which is considered
normal, but in some areas runs into the yellow band which is considered
suspicious for glaucoma.
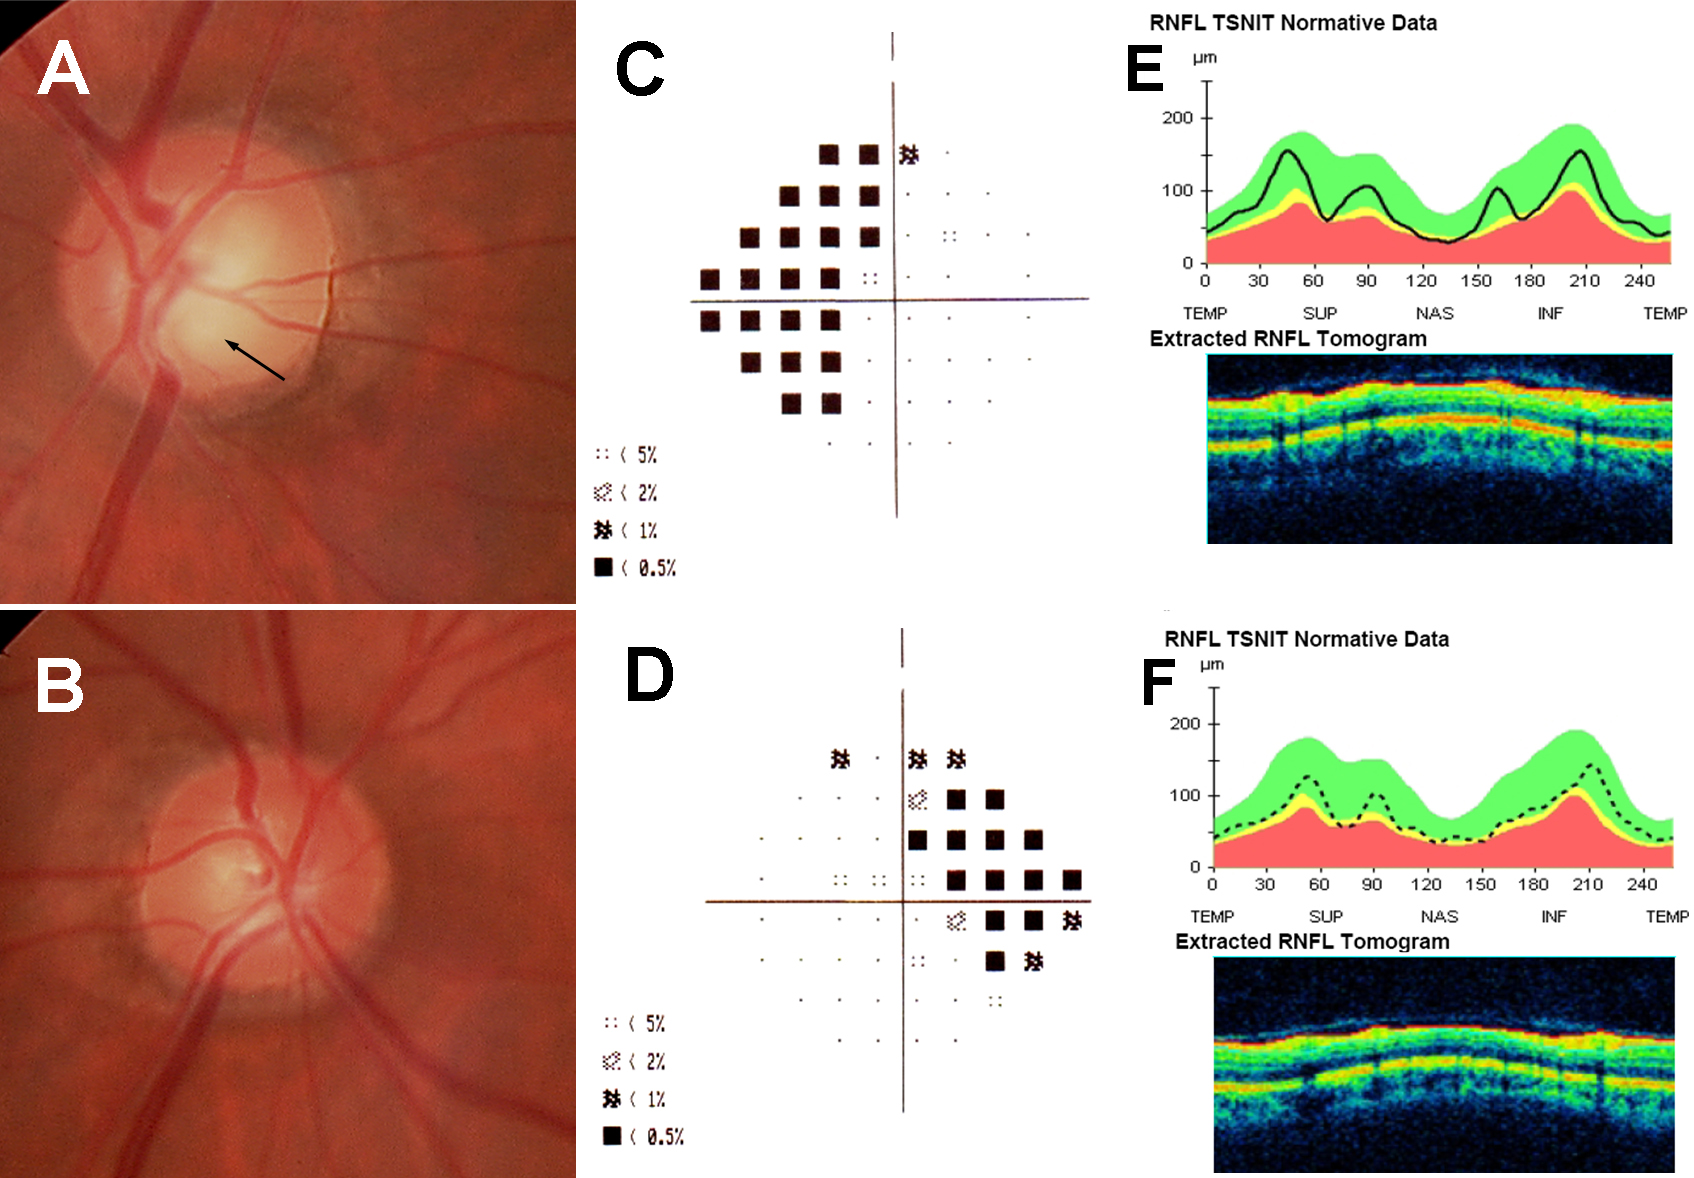
 Figure 4 of Romero, Mol Vis 2011; 17:1929-1939.