Figure 5 of
Li, Mol Vis 2011; 17:1909-1917.
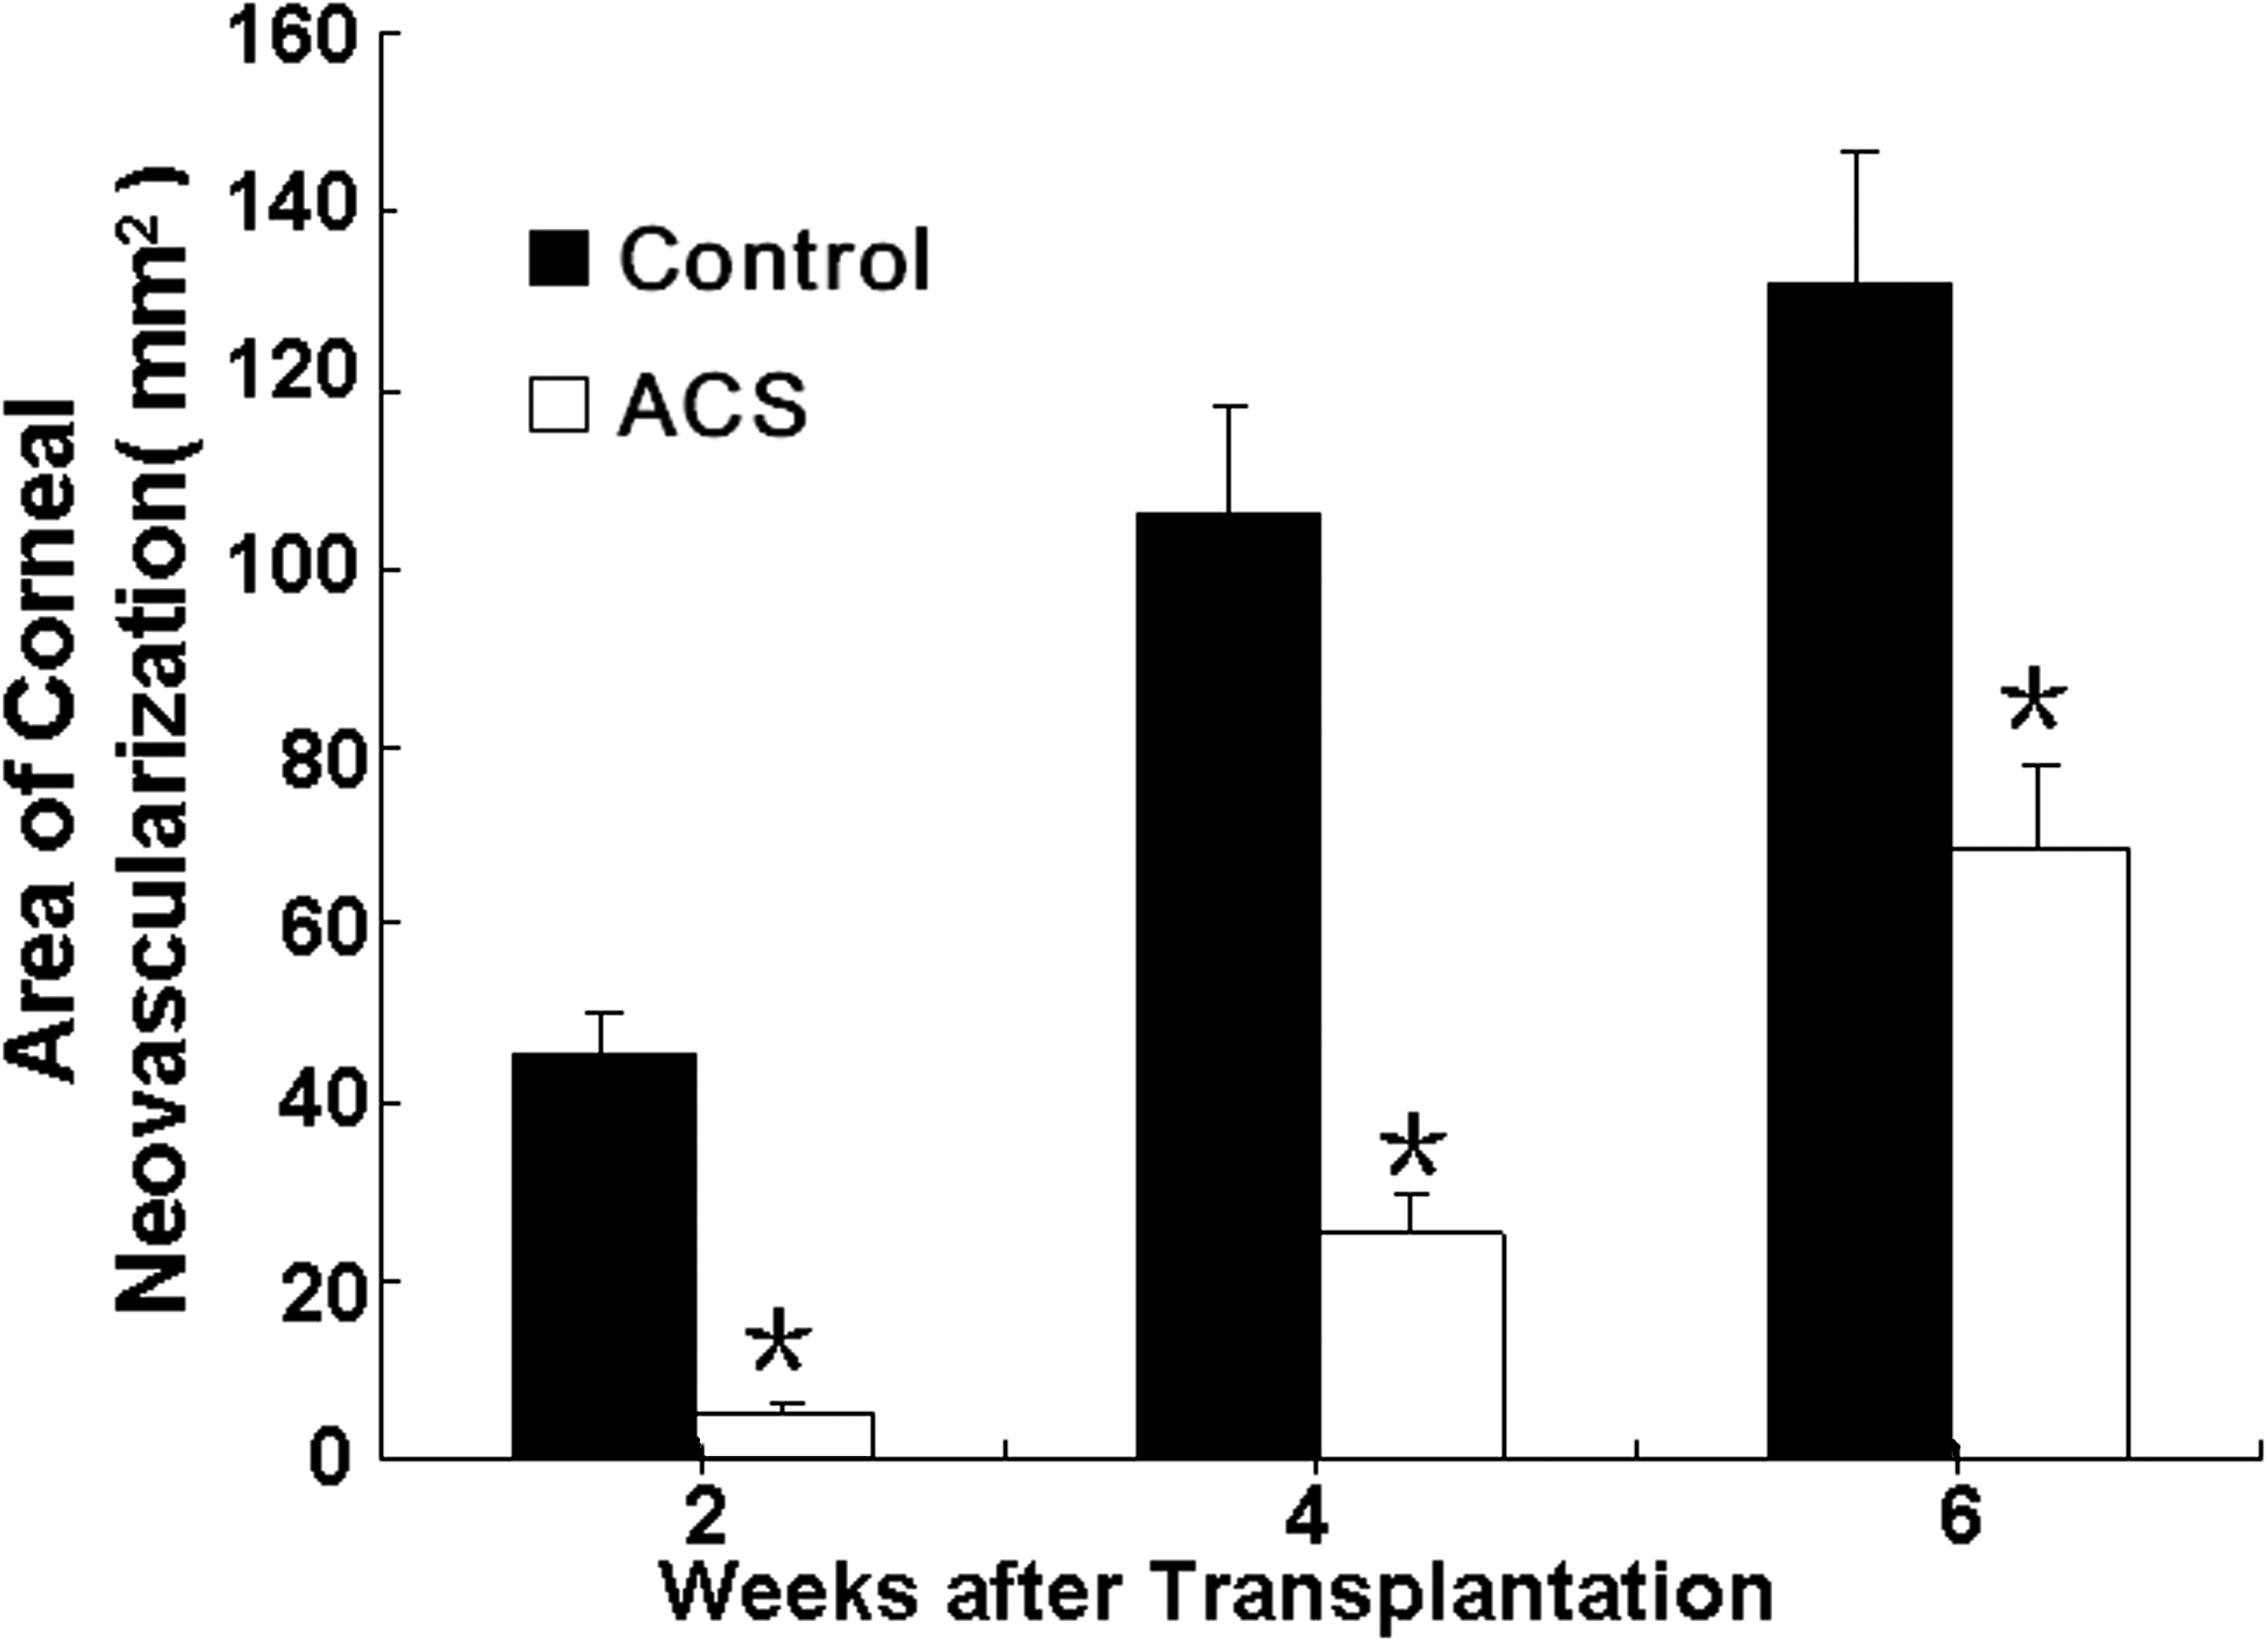
Figure 5.
Area of corneal neovascularization. The mean area in the ACS group was fewer than control group 2 and 4 weeks post-operatively (n=10, p<0.05). The asterisk indicates a p<0.05.
 Figure 5 of Li, Mol Vis 2011; 17:1909-1917.