Figure 7. Effect of ROCK inhibition on cell morphology and focal adhesions. Cells grown on coverslips were treated with 5 μM Y-27632
and 1 μM Y-39983 for 1 h in serum-rich medium and stained for paxillin and F-actin. DIC images of these cells were also taken.
A: The DIC image of untreated cells, which are spread out and have a flat appearance. B and C: Treatment with Y-27632 (5 μM) and Y-39983 (1 μM) for 1 h led to an apparent shrinkage and retraction of the cells, which
assumed a stellate appearance. D: In untreated cells, prominent stress fibers are visible. Paxillin is seen as large spots within and at the cell boundaries
(G). Treatment with Y-27632 (E and H) and Y-39983 (F and I) led to a complete loss of stress fibers and focal adhesions.
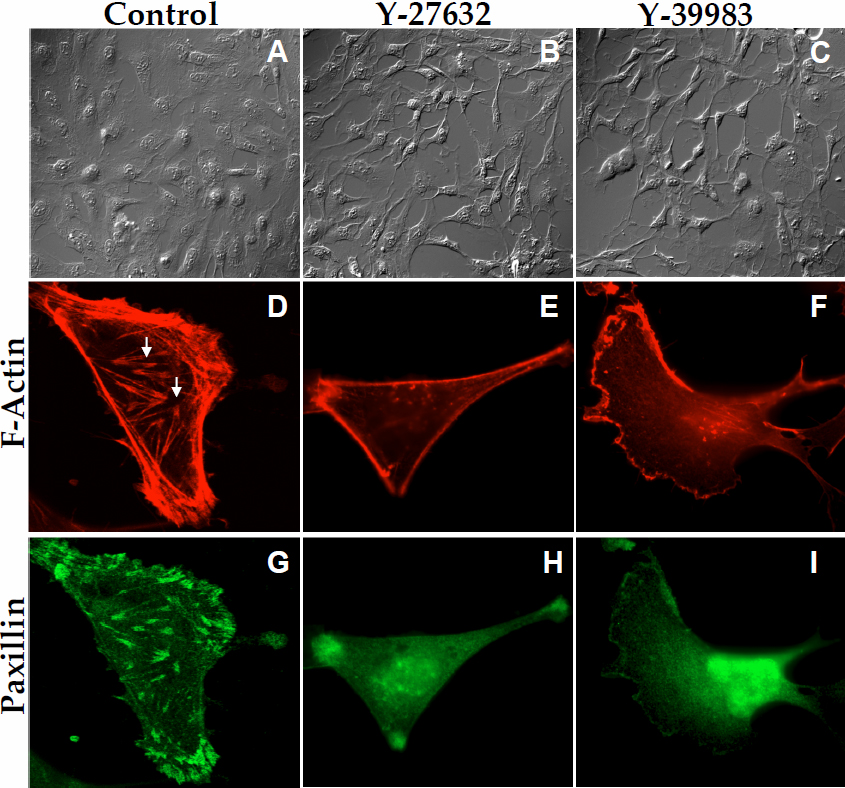
 Figure 7 of
Ramachandran, Mol Vis 2011; 17:1877-1890.
Figure 7 of
Ramachandran, Mol Vis 2011; 17:1877-1890.