Figure 6. Cell-substrate impedance sensing. A: The evolution of resistance after seeding TM cells. Upon inoculation, the resistance measured at 4 kHz increased within
3 h. This was followed by a gradual increase in resistance (around 1600 ohms), which reached a plateau around 24 h. B: The impedance changes induced by ROCK inhibitors. To measure the changes in the measured resistance, frequency scans were
taken every 30 min to obtain resistance values across 23 frequencies (23 Hz to 60 kHz) from each well. Treatment of cells
with 5 μM Y-27632 or 1 μM Y-39983, denoted by closed squares and broken lines, respectively, led to a significant decrease
in resistance. The decrease in resistance started at 30 min, reached a maximum at 1 h, and remained constant until 2 h after
treatment. C: Treatment of cells with cytochalasin D (0.125 mg/ml; closed diamonds), an actin-depolymerizing agent, led to a significant
decrease in the measured resistance. Similarly, treatment with an RGD-peptide (100 nM; a specific integrin binding peptide)
led to a significant decrease in resistance (dashed lines) compared with the control (closed circles). Data shown are expressed
as mean±SEM of three independent experiments.
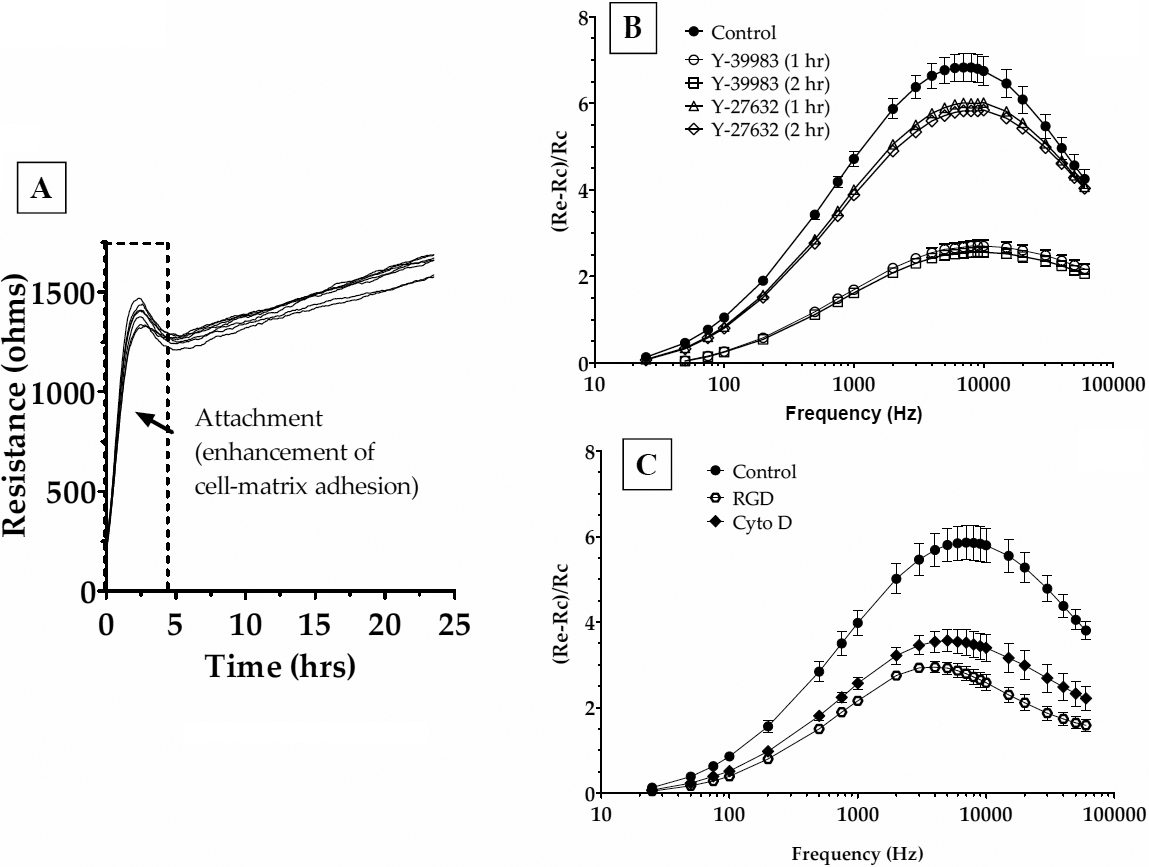
 Figure 6 of
Ramachandran, Mol Vis 2011; 17:1877-1890.
Figure 6 of
Ramachandran, Mol Vis 2011; 17:1877-1890.