Figure 4. Concentration response to Y-39983. Confluent cells were treated with Y-39983 (3 nM to 5 μM) for 1 h in serum-rich medium.
A: A typical dose response of MYPT1 and MLC phosphorylation to treatment with Y-39983 (50 nM to 1 μM). B, C, and D: Densitometric analysis of western blot data shown in panel A. B: There was a dose-dependent decrease in the phosphorylation of MYPT1 at Thr696 (IC50=177 nM). C: The inhibition of MYPT1 phosphorylation at Thr853 assumes a sigmoid curve compared with Thr696. There is a much steeper
decrease in Thr853 phosphorylation with an IC50 of 15 nM. D: The dephosphorylation of MLC followed Thr853 closely with an IC50 of 14 nM.
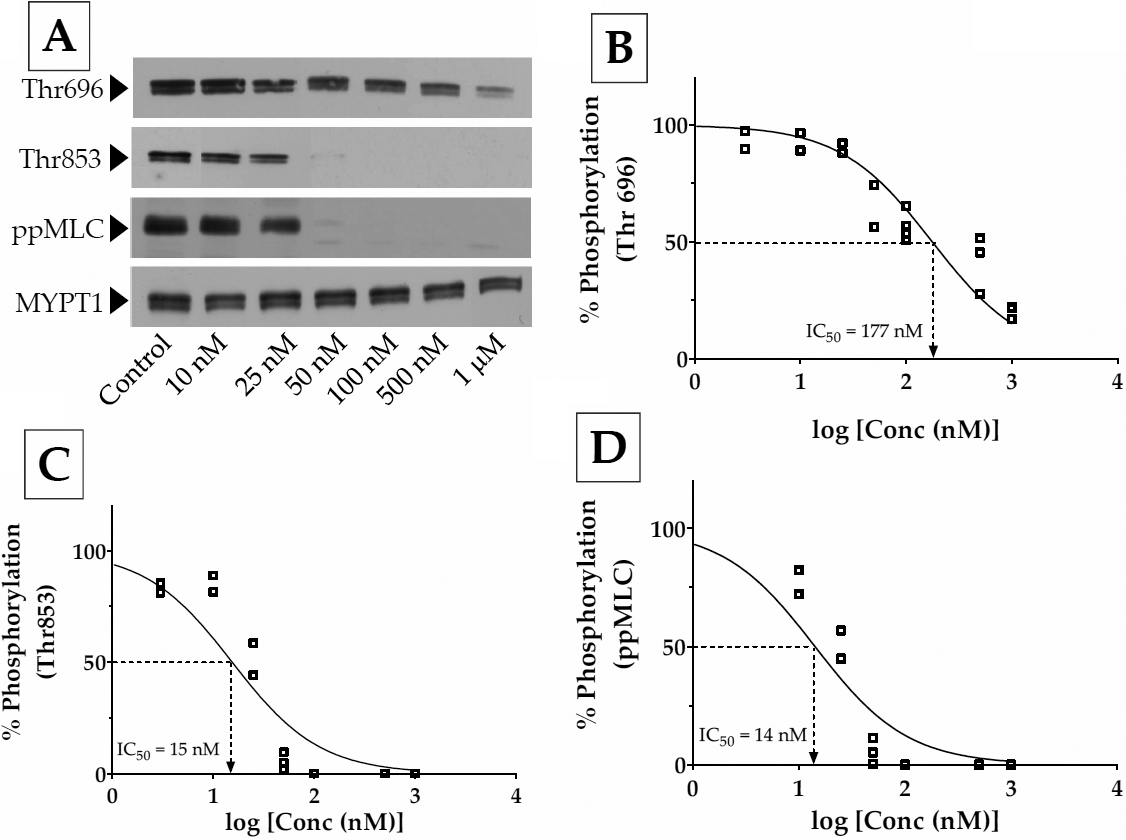
 Figure 4 of
Ramachandran, Mol Vis 2011; 17:1877-1890.
Figure 4 of
Ramachandran, Mol Vis 2011; 17:1877-1890.