Figure 3. Concentration response to Y-27632. Confluent cells were treated with Y-27632 (10 nM to 5 μM) for 1 h in serum-rich medium.
A: Representative data of the dose response of MYPT1 and MLC phosphorylation to Y-27632 (50 nM to 1 μM). There was only a marginal
decrease in the phosphorylation of MYPT1 at Thr696, even at a drug concentration of 5 μM. B, C, and D: Densitometric analysis of western blot data shown in panel A. The IC50 of MYPT1 phosphorylation at Thr696 (IC50=2270 nM; B) is three times that of Thr853 (IC50=658 nM; C). The data obtained for phosphorylation at Thr696 were less repeatable and consistent (R2=0.39) compared with that obtained for Thr853 and MLC (R2=~0.8). However, there is a better correlation between MYPT1 dephosphorylation at Thr853 and MLC dephosphorylation (D) with near complete inhibition of both at a concentration of 5 μM.
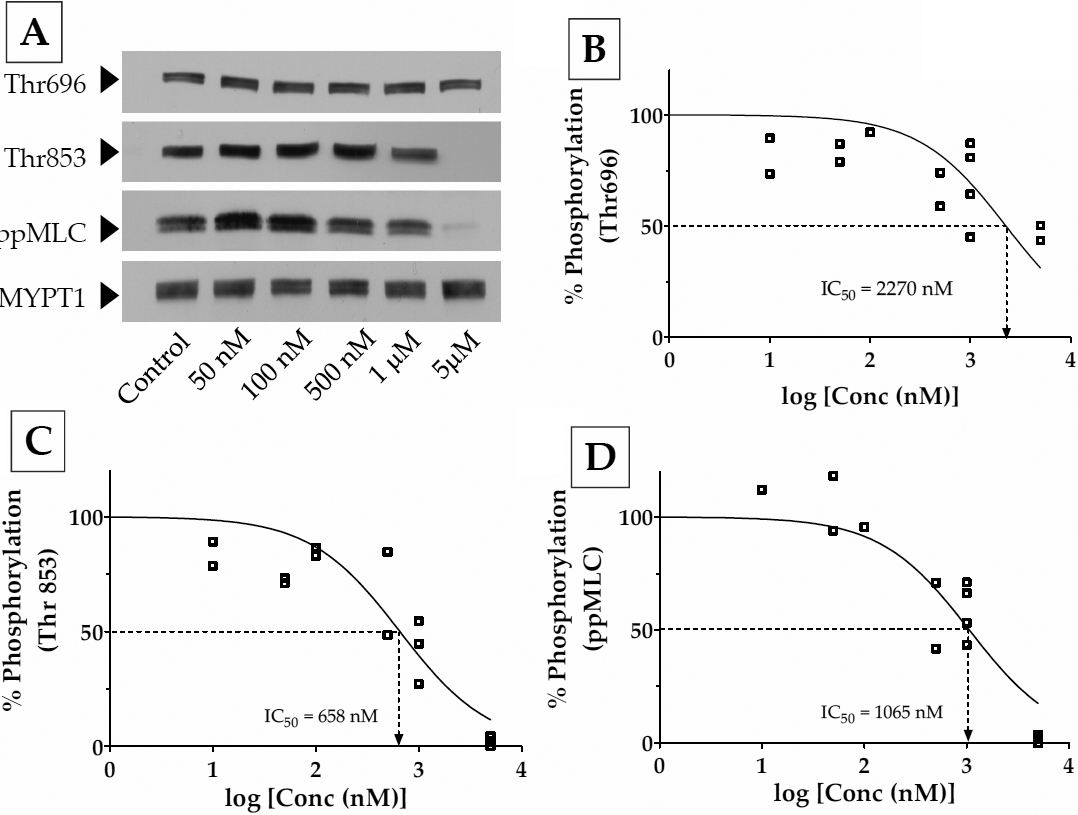
 Figure 3 of
Ramachandran, Mol Vis 2011; 17:1877-1890.
Figure 3 of
Ramachandran, Mol Vis 2011; 17:1877-1890.