Figure 2. Effect of ROCK inhibitors on the phosphorylation of MYPT1 and MLC. Cells were treated with 5 μM of the specific ROCK inhibitors,
Y-27632 and Y-39983, for 1 h in a serum-rich medium. A: Treatment with ROCK inhibitors completely opposed the phosphorylation of MYPT1 at Thr853. There was a concomitant decrease
in the phosphorylation of MLC. However, the phosphorylation of MYPT1 at Thr696 was only slightly reduced in the presence of
Y-27632 compared to Y-39983. B: In the presence of ROCK inhibitors, there was a loss in stress fibers, and the staining for MLC appeared diffuse.
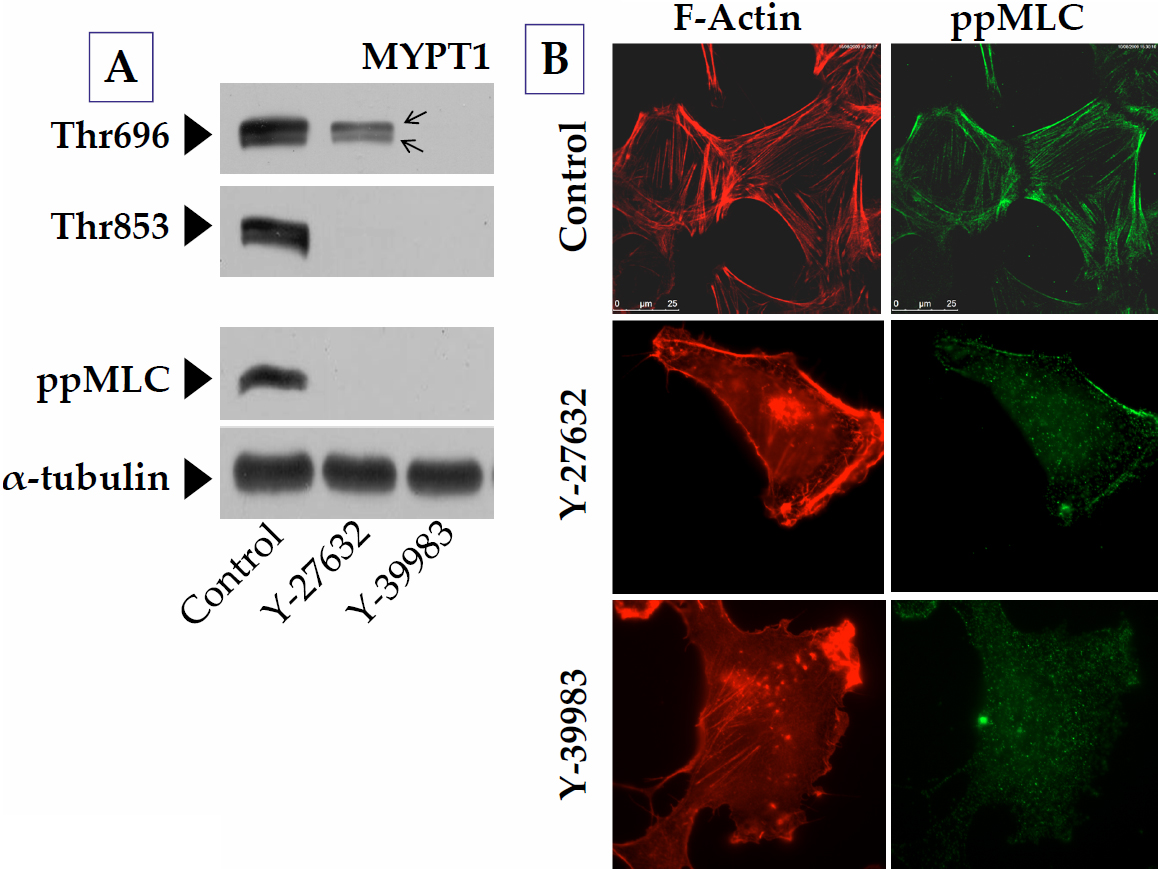
 Figure 2 of
Ramachandran, Mol Vis 2011; 17:1877-1890.
Figure 2 of
Ramachandran, Mol Vis 2011; 17:1877-1890.