Figure 1. Figure 1. Patient 4
ophthalmologic exploration. Representation of visual field of right and
left eye (A and B, respectively), Heidelberg retinal (C
and D, respectively) and optical coherence tomographic
assessments for both eyes (E). The images F and G
represent optic disc color stereophotographs of right and left eye,
respectively. The images H and I show retinal nerve
fiber layer monochromatic photographs for both eyes. Results reflect
mild nonspecific defects in the visual field, normal optic nerve
morphology, and an increase in global retinal nerve fiber layer
thickness and density.
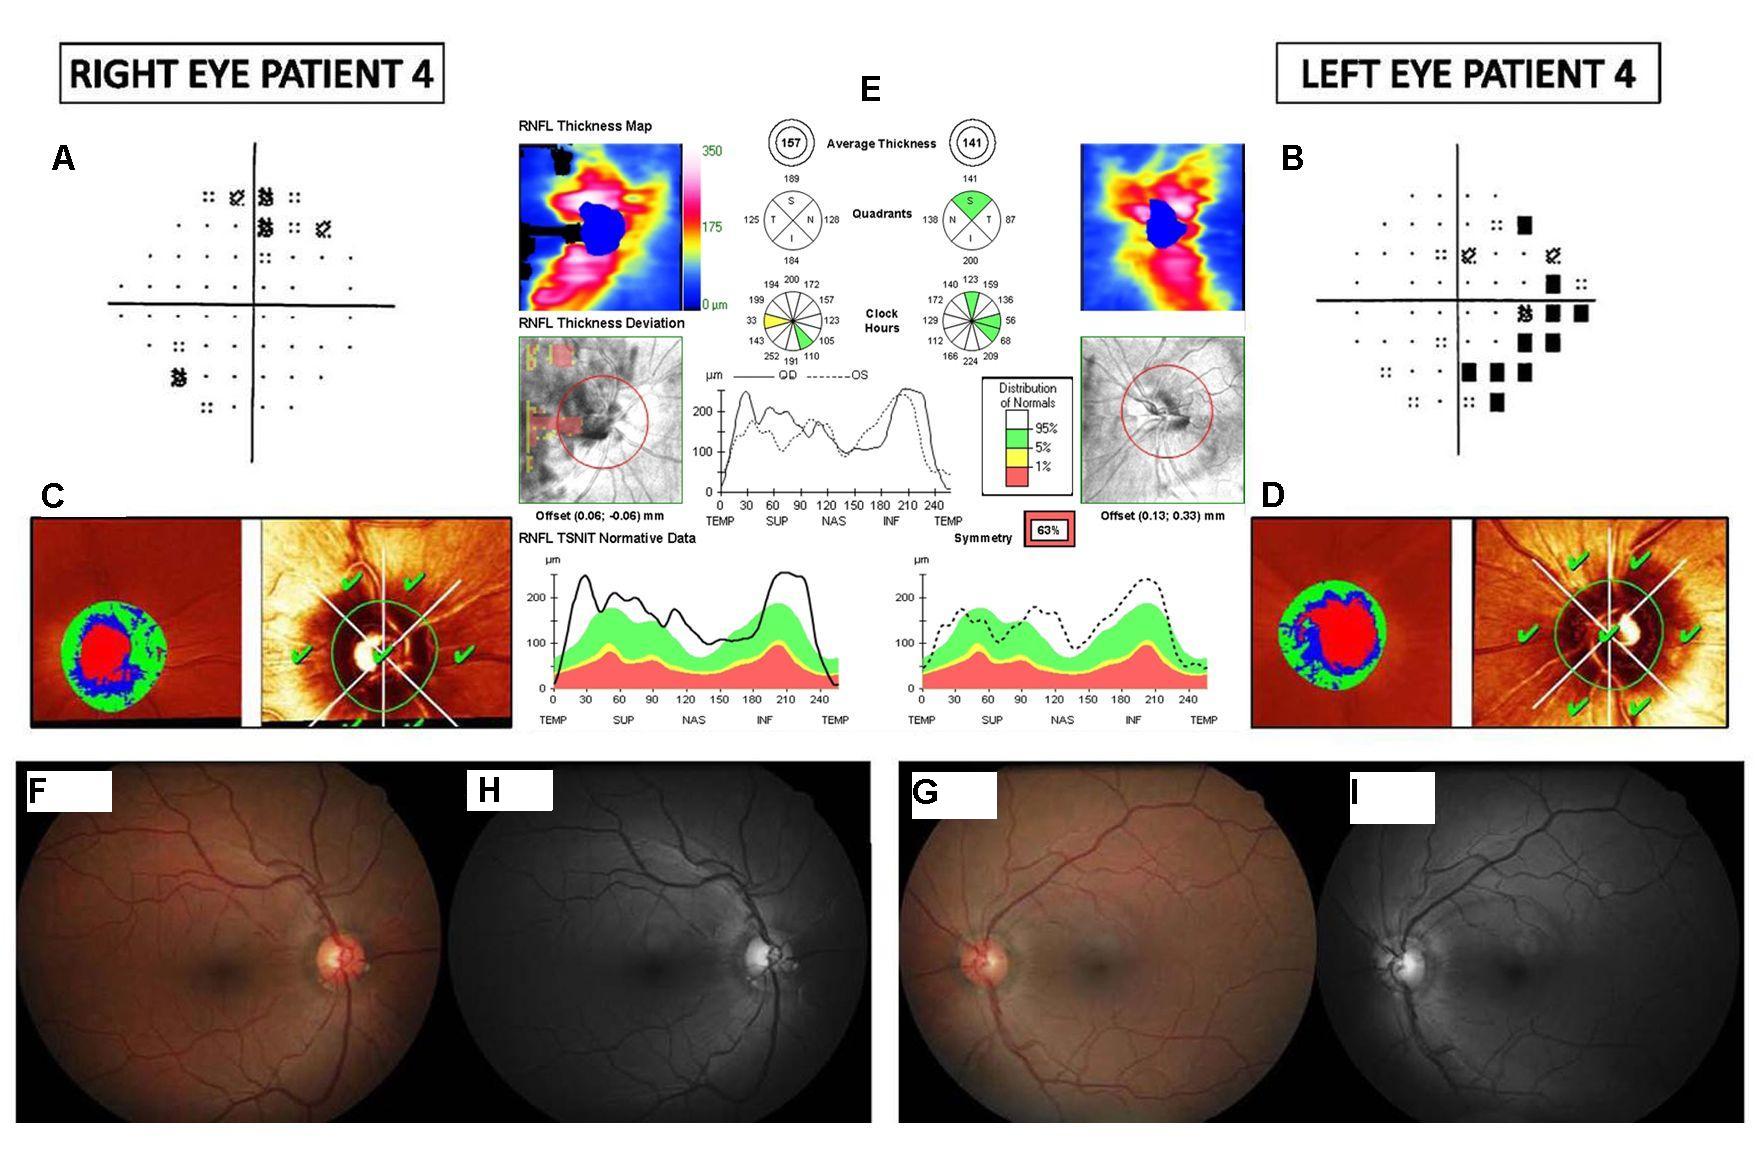
 Figure 1 of Pablo, Mol Vis 2011; 17:1871-1876.