Figure 5. SDS–PAGE analysis of
selenite-induced rat lenses treated with catalin equivalent to 2.5 and
5 mg/kg pirenoxine (PRX). M, marker; lane 1, normal; lane 2, control
(Se only); lane 3, Se+catalin formualted vehicle; lane 4–5, Se+catalin
equivalent to 2.5 mg/kg PRX; lane 6–7, Se+catalin equivalent to 5 mg/kg
PRX. Duplicated samples from different lenses of rats pretreated by
different catalin doses were analyzed. A: A 12.5% SDS–PAGE of
soluble fractions of lenses and Amersham Rainbow Marker were used. Red
arrow, 20-kDa proteins; red box, more preserved 20-kDa proteins in
catalin-treated rats; green box, preserved 26-kDa proteins. B:
A 20% SDS–PAGE of insoluble lens fractions and Fermentas SM0441 Marker
were used. Blue box, 31 kDa proteins; red box, 21–25 kDa;
black box, proteolytic fragments.
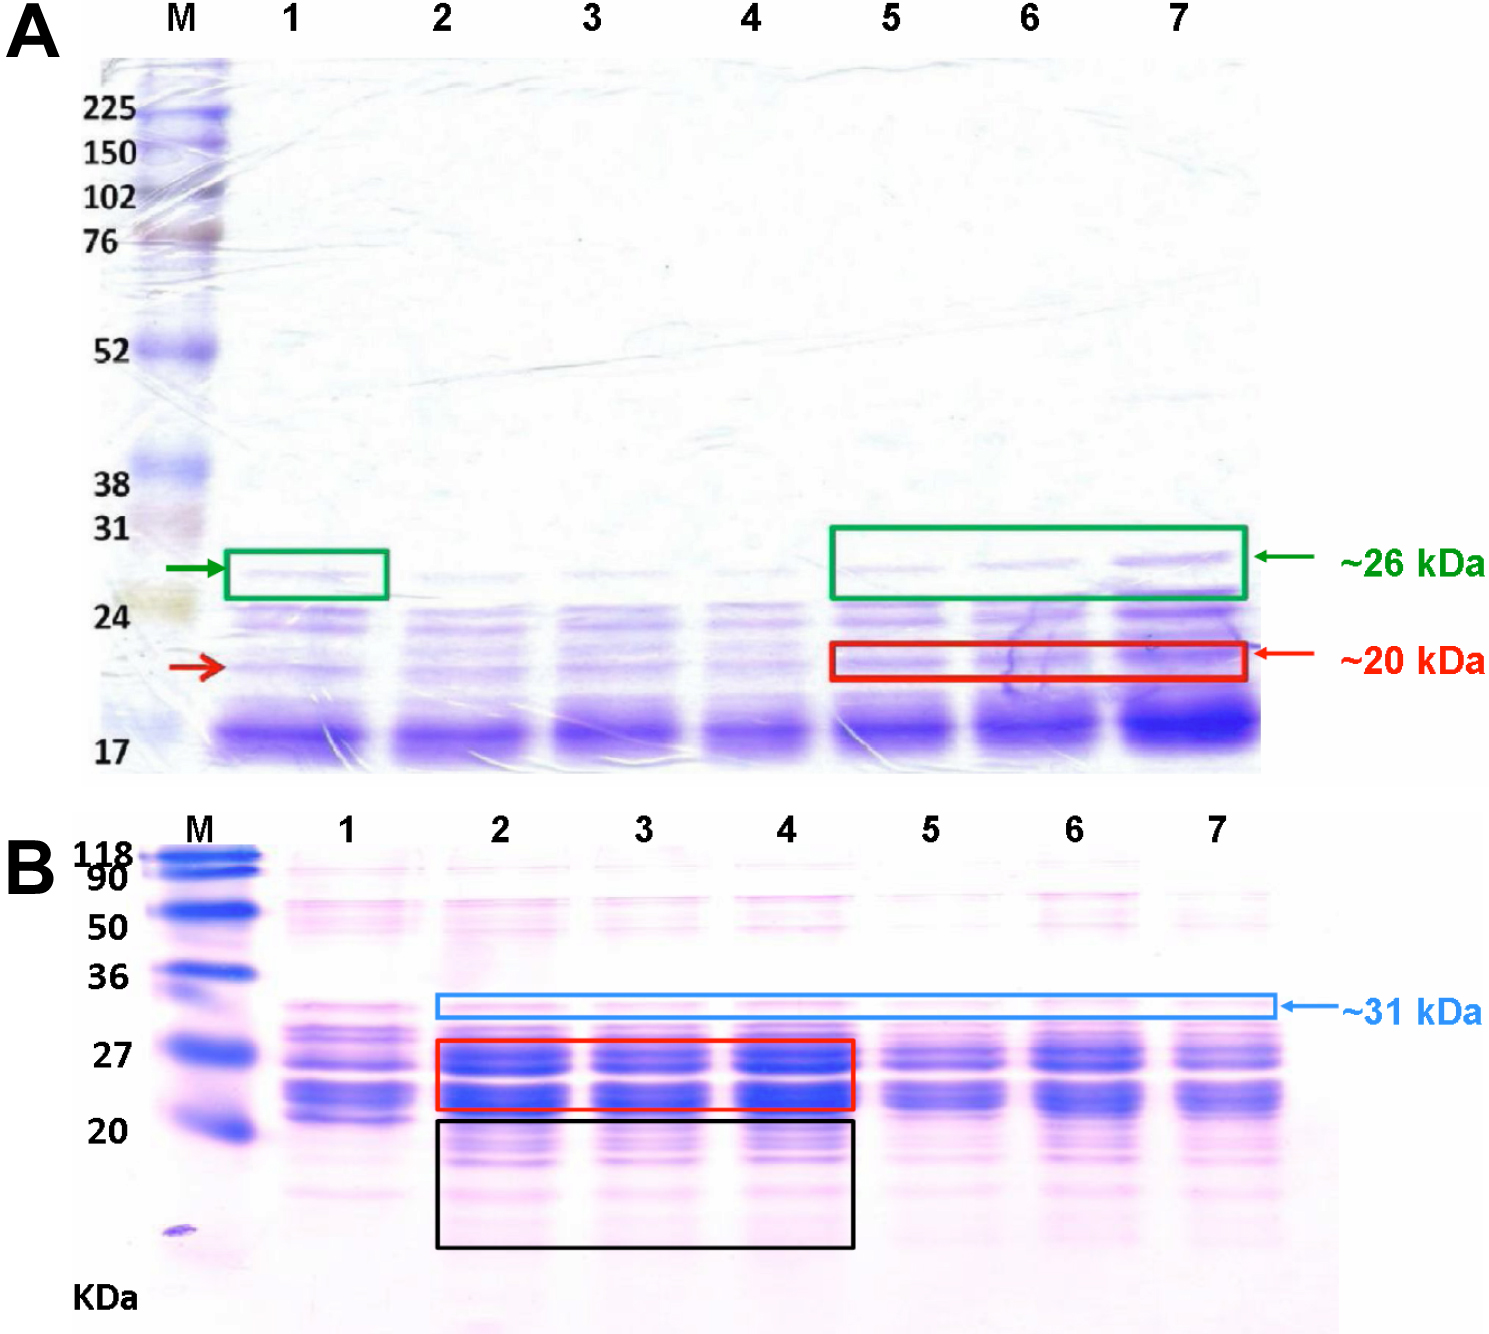
 Figure 5 of Hu, Mol Vis 2011; 17:1862-1870.