Figure 1. Photo-protection against 4 h of ultraviolet C (UVC) exposure by pirenoxine (PRX) and catalin. A: A 12% SDS–PAGE of γ-crystallins incubated with or without PRX (0~1000 μM). M, Bioladder® protein marker; lane 1, normal; 2, control; 3, 1 μM PRX; 4, 10 μM PRX; 5, 100 μM PRX; 6, 300 μM PRX; 7, 1000 μM PRX. The
protein bands in Lane 7 was similar to lane 1 (normal). B: Turbidity expressed as optical density (OD) was determined by spectroscopy at 405 nm. The y-axis indicates the OD of γ-crystallins
incubated with various doses of catalin. B16: catalin containing 16 μM PRX, B32: catalin equivalent to 32 μM PRX, B80: catalin
equivalent to 80 μM PRX, B100: catalin equivalent to 100 μM PRX, CataV: catalin-formulated vehicle only. *p<0.05 versus control
(Ctrl) group.
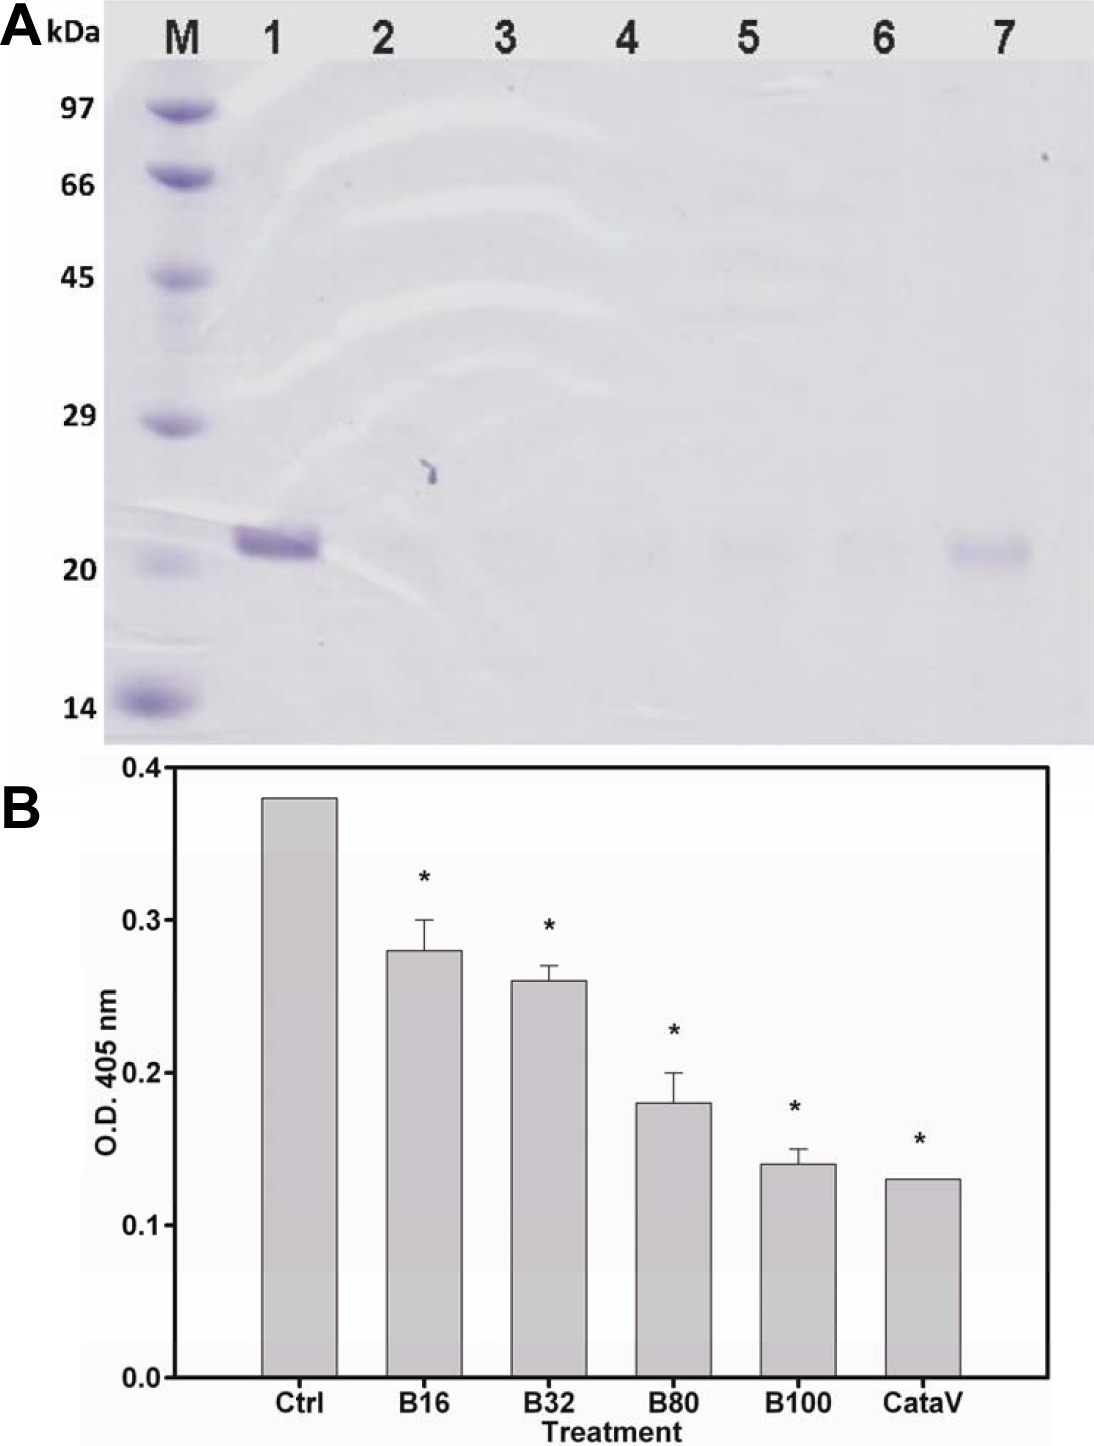
 Figure 1 of
Hu, Mol Vis 2011; 17:1862-1870.
Figure 1 of
Hu, Mol Vis 2011; 17:1862-1870.