Figure 2. Linkage and mutation analysis. A:
Multipoint
heterogeneity LOD score for families. B-F:
Sequence chromatograms for putative causal mutations in PRSS56
in families 1, 2 and 3. In each panel, upper to lower tracks contain
translation of coding exon in consensus and mutated sequences; virtual
chromatogram of consensus genomic sequence forward direction (generated
by software from text sequence); sequence chromatogram of affected
patient reverse direction; virtual chromatogram of consensus genomic
sequence reverse direction. Red arrows point to mutations in patient
samples. B: p.G320R homozygous in affected patient from family
1. C: p V302F heterozygous in affected patient from family 2. D:
c.828_833
het_ insG heterozygous in affected patient from family 2. E:
p.G237R heterozygous in affected patient from family 3. F:
p.C395P heterozygous in affected patient from family 3.
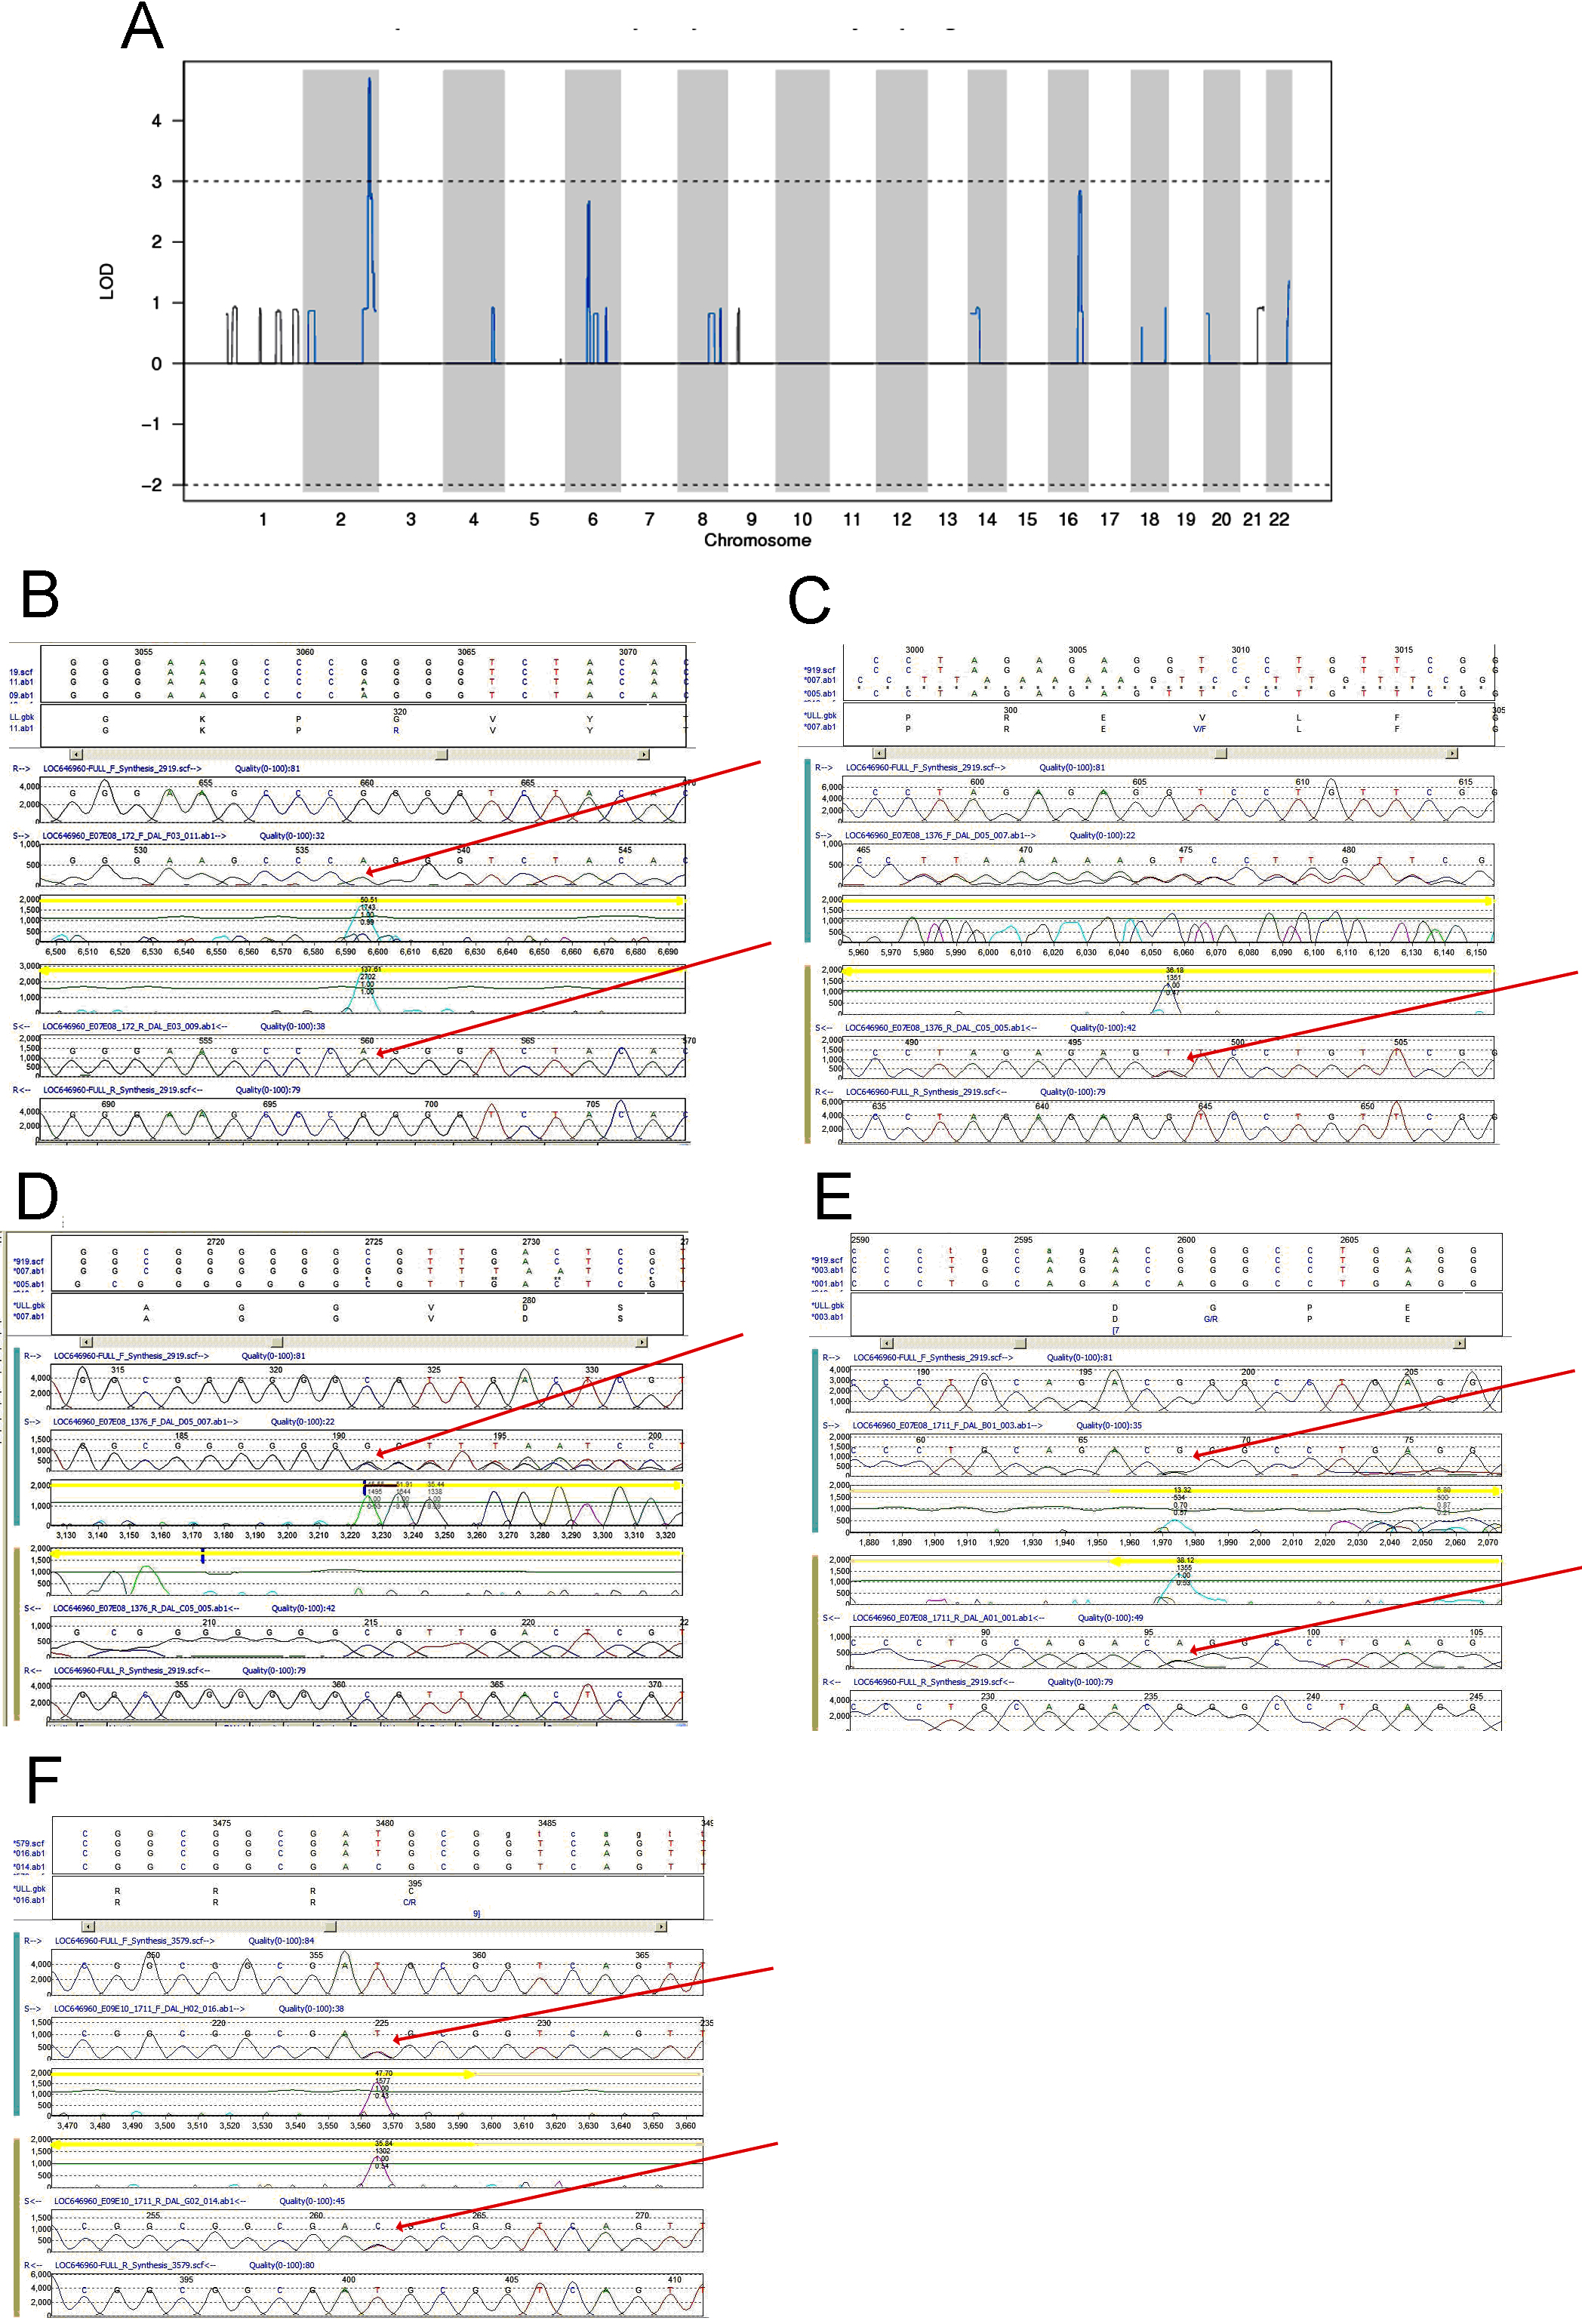
 Figure 2 of Orr, Mol Vis 2011; 17:1850-1861.