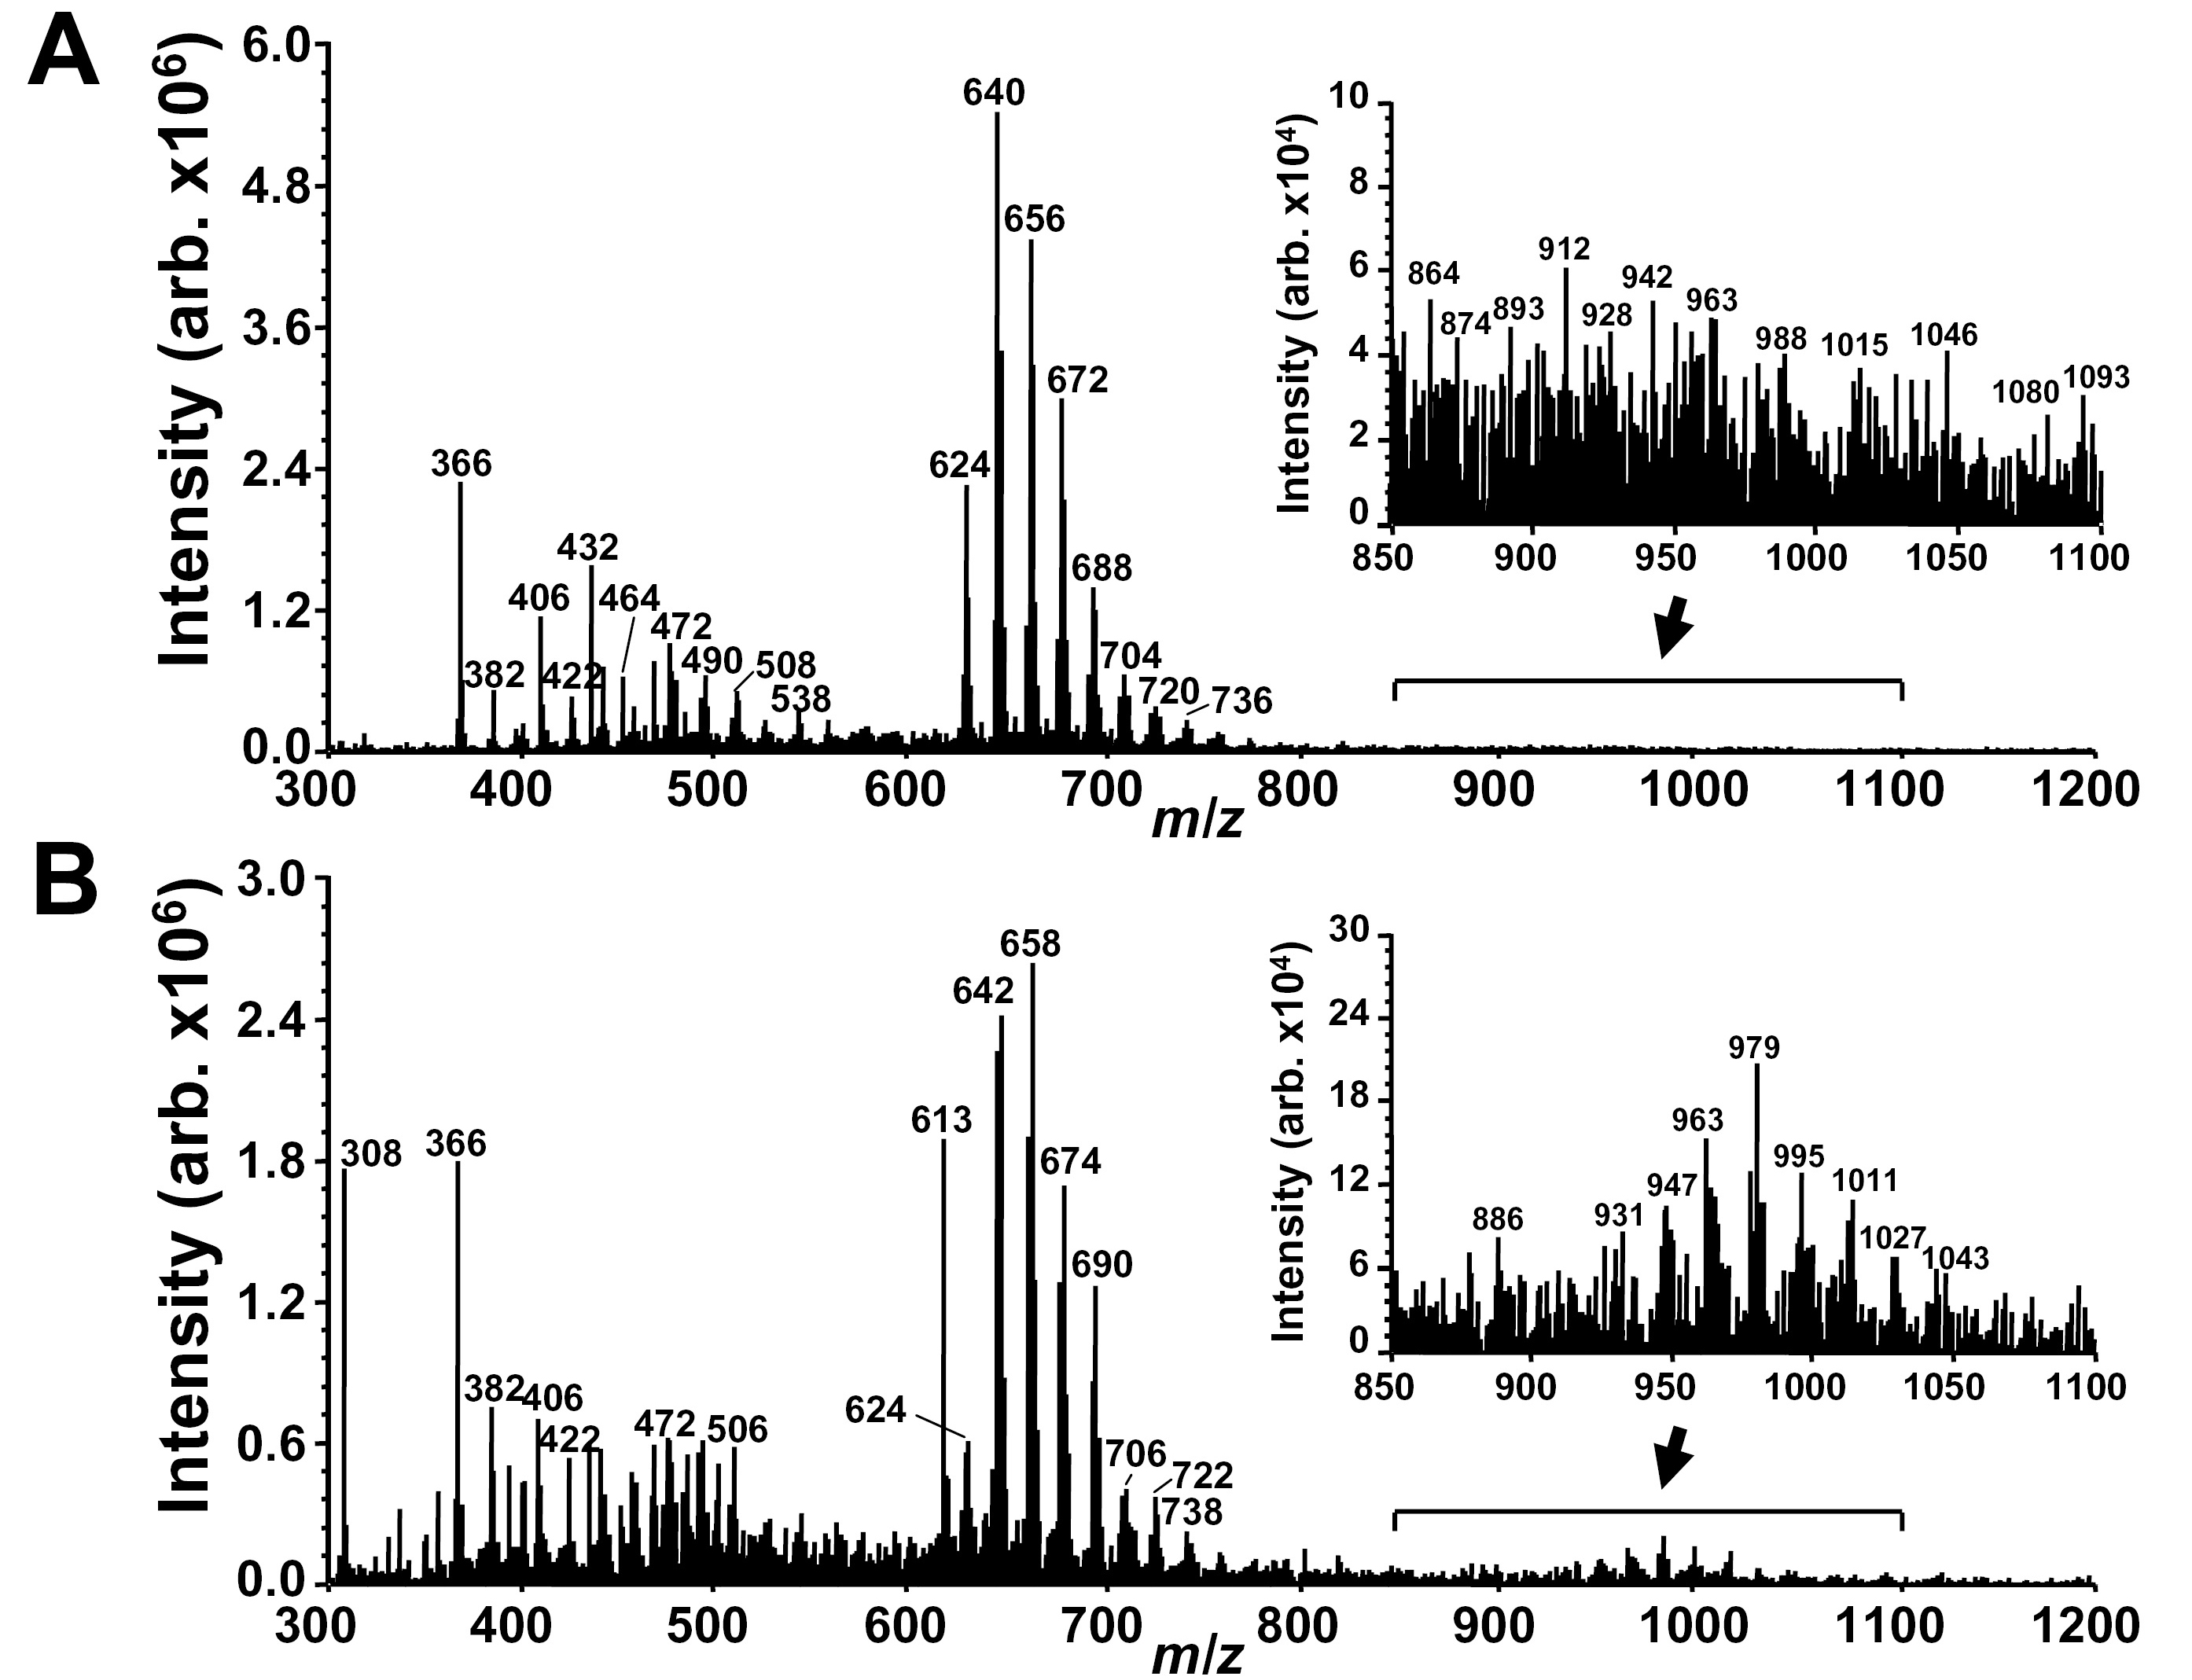
Figure 4. Electrospray ionization (ESI)
mass spectral analysis of A2E irradiated (430 nm, 20 min) in the
absence (
A) and presence (
B) of glutathione (GSH). A2E,
m.w. 592, 200 μM; GSH, 10 mM.
A: The series of peaks at 592 <
m/z
<736 reflect A2E photooxidation products (592 + n*16, n=1, 2…9).
Lower mass peaks (<
m/z 592) correspond to A2E photocleavage
products.
B: The peaks at 592 <
m/z <738 exhibit
m/z+2
relative
to A2E photooxidation products in A. The series of peaks at
m/z
931, 947, 963, 979, 995, 1011, 1027, and 1043 are photooxoA2E-GSH
adducts (mechanisms of formation are proposed in
Figure 6).
Insets in
A and
B: expanded view in range of
m/z
850–1100. Note that the y-axis scale is magnified in B to facilitate
resolution.
 Figure 4 of Yoon, Mol Vis 2011; 17:1839-1849.