Figure 4. Morphology of primary cultured HLE cells and expression of AREG and GDF15 in UVB-exposed primary cultured HLE cells. The capsular flaps were obtained from 5 patients (A–E) and split in half, and
halves were cultured for 2 weeks. A: A typical phase contrast micrograph of primary culltured HLE cells after a 2-week culture is shown. Note that almost all
the cells outgrown from the capsules had small, polygonal shapes. One of doublet cultures was irradiated at 50 mJ/cm2 and another culture was subjected to sham operation. Total RNAs were extracted at 24 h after UVB exposure and relative mRNA
levels of AREG and GDF15 were analyzed using real-time PCR (B) and RT–PCR (C). B: Relative mRNA levels of AREG (upper). Relative mRNA levels of GDF15 (lower). Values were normalized with GAPDH mRNA. The respective values of UVB-exposed culture are compared to values of the corresponding sham-operated cultures (No
UVB). *p<0.05, **p<0.01, compared to controls (No UVB). C: RT–PCR products of RNAs from cultures for patient A and B. Aliquots (10 μl) of each RT–PCR product for AREG (20 ng, 38 cycles), GDF15 (20 ng, 33 cycles) and β-actin (ACTB; 20 ng, 24 cycles) were electrophoresed on 2% agarose gels containing ethidium bromide.
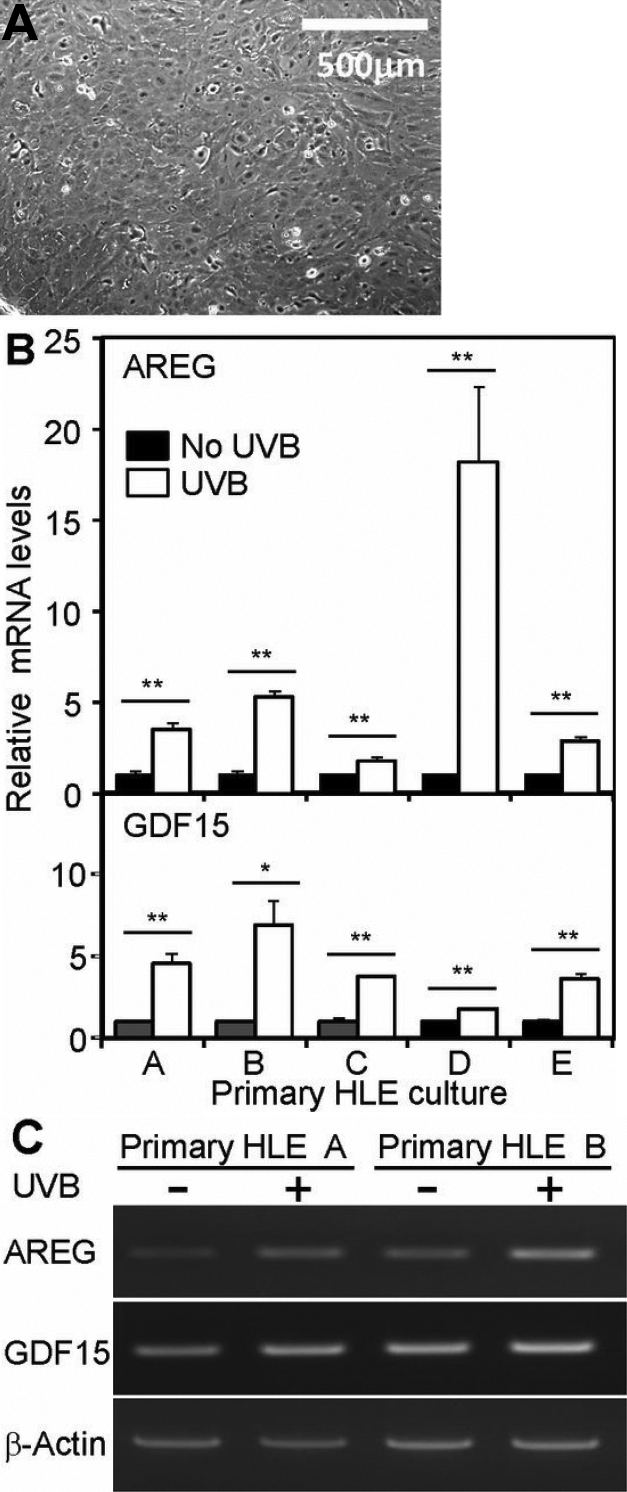
 Figure 4 of
Osada, Mol Vis 2011; 17:159-169.
Figure 4 of
Osada, Mol Vis 2011; 17:159-169.