Figure 2. RT–PCR and real-time PCR analysis of AREG and GDF15 expression in UVB-irradiated SRA01/04 cells. SRA01/04 cells were exposed at 0, 30, and 50 mJ/cm2 UVB and total RNAs were extracted 12 h and 24 h later. Relative mRNA abundance of AREG and GDF15 was examined using RT–PCR (A) and real-time PCR (B). A: RT–PCR products of AREG, GDF15, and β-actin (ACTB) mRNAs. The RNA amounts and PCR cycle numbers were 100 ng and 30 cycles (AREG), 100 ng and 29 cycles (GDF15), and 100 ng and 20 cycles (ACTB). Aliquots (10 μl) of each RT–PCR product were electrophoresed on 2% agarose gels containing ethidium bromide. B: Relative mRNA levels of AREG (left). Relative mRNA levels of GDF15 (right). Values were normalized with GAPDH mRNA, and compared to values of controls (sham-irradiated cells). Essentially the same results were obtained with three independent
experiments, and representative data are shown. *p<0.001, compared to controls.
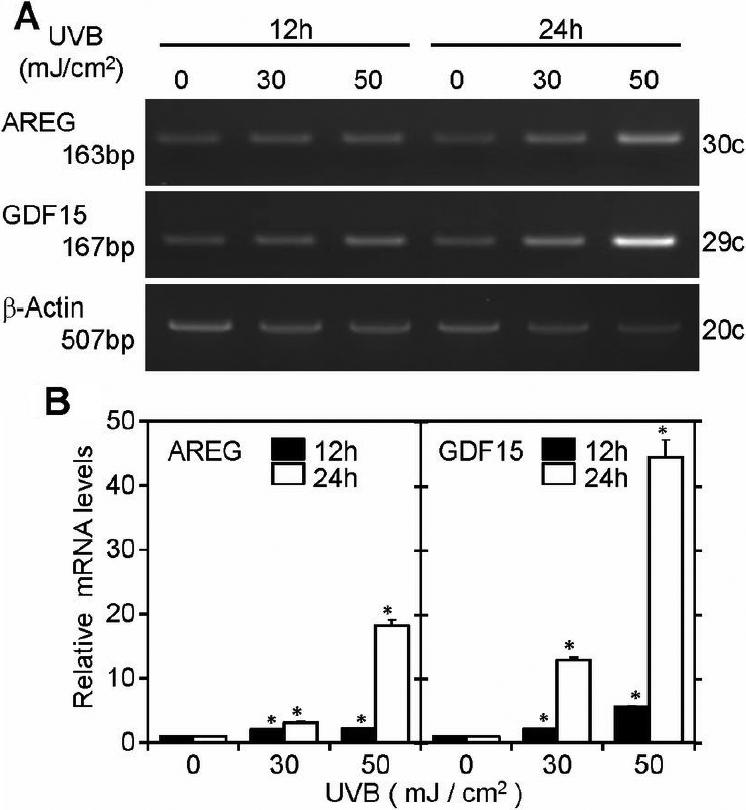
 Figure 2 of
Osada, Mol Vis 2011; 17:159-169.
Figure 2 of
Osada, Mol Vis 2011; 17:159-169.